Bring Time-tested Reliability Tools to Bear on Maintenance Problems
Reliability Block Diagrams have been around for a very long time, helping system engineers understand how the various elements, and their relationships, could impact the overall reliability and operation of the system. Taking the effort to diagram a system logically can provide great insight into where the weak links are. In some cases, an RBD can expose that your assumed redundancies are not actually as effective as you think they are.
A system, when viewed logically vs. physically, can look quite different.
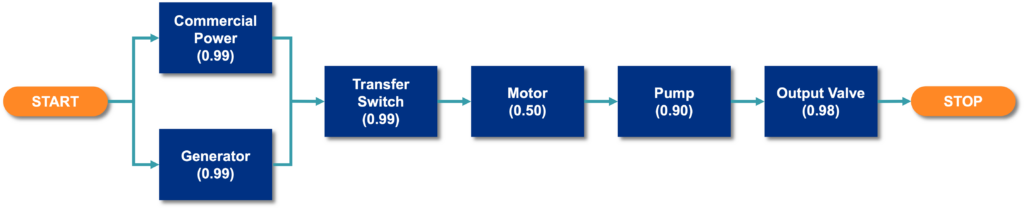
Let’s get to the fun! Get out your pencil and make a diagram of one of your critical systems. Simply draw blocks in paths that represent each element or module of the system. The system below is an electrically powered pump with a valve controlling the output. Of course, many other elements of the system could be added: the control system, the piping and wiring between blocks, etc. Keep it simple for now.
Now assign a reliability number to each block. What is your guesstimate probability of each block being available for use at any point in time? Be honest… 95%? 80%? 50/50?
Try these values:
Commercial Power or Generator = 99%
Transfer Switch = 99%
Motor = 50%
Pump = 90% (given an assumed production rate)
Valve = 98%
Now take all these numbers and multiply them together:
P = .99 x .99 x .50 x .90 x .98 = .43
Whoa! You mean to tell me that my system is only 43% reliable at any point in time? It has a whopping 57% probability of being failed? This is frightening! Obviously that pesky motor in the middle of the diagram is killing our system reliability.
It’s ok… its just an overly simplified view of a system to help prove a point. Or is it?
Advanced Topic
Yes, we introduced a parallel path in this diagram. Our system is powered by commercial power or a backup generator at any point in time. This redundancy can (not always) greatly increase the reliability of the system since one or the other is supplying power, based upon their probability. Since they are both very high, 99%, then: P = (.99 +.99)/2 = .99 for the two as a “system.” You can see how a reliability block diagram can quickly get complicated!
What is a Reliability Block Diagram?
A reliability block diagram serves two purposes: one is to logically diagram a system to give you a good visual. The second is to provide a calculation approach, much like we did above. Blocks in series are, “and,” while blocks in parallel are, “or.”
From a diagramming perspective, you can use any software tool that makes flowcharts. (Pencils are fine too!) The diagram begins and ends with nodes that are used to indicate the bookends of the system. In an actual RBD calculation or analysis software tool set, these nodes serve a mathematical purpose as well, but for our case we can just call them start/stop nodes.
The blocks in the diagram are interconnected in either parallel or serial fashions. It is an interesting exercise to try and draw a system you are very familiar with. Making the decision as to whether the elements of the system are in parallel or serial may seem simple, but not always. Remember, you are diagramming a system… not necessarily a flow or path of production.
Parallelism indicates redundancy or multiple paths to get something done. Serial structures indicate that if any block fails, the entire system fails. Most systems are just serial strings of equipment… if any one element fails, the entire thing fails. Weakest link and all that.
Think of your car. Put aside all the non-essential pieces of it… lights, satellite radio, windows, spinning rims, etc. and diagram it out. Engine, battery, transmission, wheels (yes, you need all four!) and so on. Placing all these elements in a serial structure you can see if any fail, the car, as a system, fails. There is little to no redundancy in the typical car.
Fun with numbers
Now that you have a diagram to work with, the hard work begins to find some data that you can use to come up with “real numbers,” for each block. Your maintenance organization may have vast amounts of system and equipment availability data… or not. Either way, finding sources of this kind of data can be a challenge. What you do find may be very inconsistent and full of holes. At this point its ok. We are just looking for approximations.
Let’s use that motor as an example. With our guesstimate of 50% probability that it will be operational… maybe it is working, maybe it is not… we should find data to support our assertion. You may be in a situation where, “everyone knows,” that Motor #2 is problematic, and the team just pays attention to it each Monday morning to keep it limping along.
If that is the case, then you should be able to find maintenance records that support the situation Motor #2 is in. Let’s say that relative to other motors you have, Motor #2 seems to need corrective action once a month. Your mean time between failure (MTBF) is 30 days. (Add up the days between each failure and divide by the number of failure events.)
Now you are a Reliability Engineering professional! Remember, we are only looking for relative and qualitative values at this point. No need to dig too deep into the data nor perform true statistical analysis yet. We are just looking for obvious weak links on our equipment chains. Is it acceptable for the motor to fail each month.
Now what?
It has been said that if the only tool you have is a hammer, then everything looks like a nail! Most likely you are mentally diagramming all sorts of systems in your mind right now.
Even better, reliability block diagrams can be used for more than just systems of equipment. They can visualize steps or functions in a process… anything that can be represented as sets of series or parallel relationships. Assign a probability of each being functional and you can quickly get a handle of the overall system effectiveness. Then you can go from the qualitative or anecdotal estimates to find real data that either confirm your gut-feelings or not. Either way, you have a much better view of what is, or can happen, to your systems of equipment.
Back to our simple diagram. Now you can see that the expense and benefit of the backup generator to increase the system reliability is being wiped out by that pesky motor. Figure out why that motor is having such a bad time and your system will serve you better. Spend your time and money on those elements that are proving themselves to be less than, “good.” You will never achieve 100% system reliability, but now you know where to go look for opportunities.
If you are interested in more information, let us help, email AskTRM@trmnet.com. If you are interested in reliability consulting, contact us at IDCON.com we can help you with your reliability needs.
John Q. Todd
John Q. Todd has nearly 30 years of business and technical experience in the Project Management, Process development/improvement, Quality/ISO/CMMI Management, Technical Training, Reliability Engineering, Maintenance, Application development, Risk Management, & Enterprise Asset Management fields. His experience includes work as a Reliability Engineer & RCM implementer for NASA/JPL Deep Space Network, as well as numerous customer projects and consulting activities as a reliability and spares analysis expert. He is a Sr. Business Consultant and Product Researcher with Total Resource Management, an an IBM Gold Business Partner – focused on the market-leading EAM solution, Maximo, specializes in improving asset and operational performance by delivering strategic consulting services with world class functional and technical expertise.
When we have catastrophic events such as the club fire in RI, the inspection process that allowed code violations to go uncorrected for two years needs to be revisited. Many inspectors view their daily work in a way that results in the low hanging fruit getting picked, but the more difficult to reach fruit on high branches going untouched. When an agency is responsible for inspections for compliance with safety, health, fire and/or environmental standards there needs to be a meaningful quality control or improvement program in place. Citizens or your community deserve no less.
When we have catastrophic events such as the club fire in RI, the inspection process that allowed code violations to go uncorrected for two years needs to be revisited. Many inspectors view their daily work in a way that results in the low hanging fruit getting picked, but the more difficult to reach fruit on high branches going untouched. When an agency is responsible for inspections for compliance with safety, health, fire and/or environmental standards there needs to be a meaningful quality control or improvement program in place. Citizens or your community deserve no less.
Corporations throughout the world are losing billions of dollars in wasted project spending, and this waste is being carefully hidden from management and investors. A new global research report shows that one of the biggest contributing factors is the lack of alignment of projects with corporate strategy.
Corporations throughout the world are losing billions of dollars in wasted project spending, and this waste is being carefully hidden from management and investors. A new global research report shows that one of the biggest contributing factors is the lack of alignment of projects with corporate strategy.
Oh "Overall Equipment Effectiveness", I've heard about that before! Unfortunately, in many facilities, that's all OEE (Overall Equipment Effectiveness) is to the personnel. Something they heard of, talked about or read about. Many maintenance departments today still do not effectively utilize the OEE tool even though it's widely used among the world class companies.
Oh "Overall Equipment Effectiveness", I've heard about that before! Unfortunately, in many facilities, that's all OEE (Overall Equipment Effectiveness) is to the personnel. Something they heard of, talked about or read about. Many maintenance departments today still do not effectively utilize the OEE tool even though it's widely used among the world class companies.
Maintenance practices and technologies have evolved to meet the needs of the changing industrial environment. The function has evolved from a community of reactive fixers, to dedicated craftsmen, to proactive professionals. The next generation of personnel could well be based on practitioners of Quality Management Systems (QMS).
Maintenance practices and technologies have evolved to meet the needs of the changing industrial environment. The function has evolved from a community of reactive fixers, to dedicated craftsmen, to proactive professionals. The next generation of personnel could well be based on practitioners of Quality Management Systems (QMS).
A custom blueprint for streamlining internal processes, Lean has helped to increase production at many plants. Except, all too often, these plants don’t enjoy the maximum return on their investment. This is because managers often limit their Lean implementations to production-related processes. Such applications provide only a fraction of the benefit Lean is designed to offer and often deprive plants of achieving the true potential for growth and development.
A custom blueprint for streamlining internal processes, Lean has helped to increase production at many plants. Except, all too often, these plants don’t enjoy the maximum return on their investment. This is because managers often limit their Lean implementations to production-related processes. Such applications provide only a fraction of the benefit Lean is designed to offer and often deprive plants of achieving the true potential for growth and development.
When a forced layoff takes place in a unionized environment, the latest employees, in this case the apprentices were laid off; the plant had to lay off its future employees. Even sadder is that only four months after the lay offs the plant had to hire back many of the people they laid off. Many of them worked for a contractor who had contracted them to the plant after they were laid off! Soon this plant will start talking about a new improvement initiative and new management will wonder why it is so difficult to get people committed to improvement initiatives.
When a forced layoff takes place in a unionized environment, the latest employees, in this case the apprentices were laid off; the plant had to lay off its future employees. Even sadder is that only four months after the lay offs the plant had to hire back many of the people they laid off. Many of them worked for a contractor who had contracted them to the plant after they were laid off! Soon this plant will start talking about a new improvement initiative and new management will wonder why it is so difficult to get people committed to improvement initiatives.
You can develop, document, and preach your improvement plans as much as you want, but if those plans do not result in better front line maintenance performance, you have just wasted money and time. Maintenance managers cannot produce expected results without the help of others, especially the frontline. Those organizations that have experimented with autonomous teams lacking front line leadership often fail to deliver sustainable results. If you believe this statement is wrong, I am very interested in hearing back from you.
You can develop, document, and preach your improvement plans as much as you want, but if those plans do not result in better front line maintenance performance, you have just wasted money and time. Maintenance managers cannot produce expected results without the help of others, especially the frontline. Those organizations that have experimented with autonomous teams lacking front line leadership often fail to deliver sustainable results. If you believe this statement is wrong, I am very interested in hearing back from you.
Chillers and their refrigerants require ongoing preventative maintenance. Preventing refrigerant from leaving, preventing air from entering, and preserving refrigerant quality are all a part of chiller maintenance. By maintaining your chillers and by preventing chiller leaks you will also keep your operating costs down.
Chillers and their refrigerants require ongoing preventative maintenance. Preventing refrigerant from leaving, preventing air from entering, and preserving refrigerant quality are all a part of chiller maintenance. By maintaining your chillers and by preventing chiller leaks you will also keep your operating costs down.
Traditionally, reliability engineers have been the leaders in introducing new maintenance processes and technologies. With the start of predictive maintenance, many other branches of the organization will become part of the process; at a minimum, there will be strong IT involvement and involvement of the COO or VP of operations. Furthermore, companies might have an IoT strategy unit, a digital unit, or an analytics center, all of which will be interested in the rollout of predictive maintenance.
Traditionally, reliability engineers have been the leaders in introducing new maintenance processes and technologies. With the start of predictive maintenance, many other branches of the organization will become part of the process; at a minimum, there will be strong IT involvement and involvement of the COO or VP of operations. Furthermore, companies might have an IoT strategy unit, a digital unit, or an analytics center, all of which will be interested in the rollout of predictive maintenance.
According to the U.S. Bureau of Labor Statistics, workers sustained a collective 2.9 million workplace injuries and illnesses in 2015, and nearly 5,000 workers were killed on the job—an average of 13 employees every day. As employers try to curtail those shocking numbers and improve safety throughout their facility, it’s important to examine the relationship between a safer workplace and ensuring uptime, reliability and quality asset performance.
According to the U.S. Bureau of Labor Statistics, workers sustained a collective 2.9 million workplace injuries and illnesses in 2015, and nearly 5,000 workers were killed on the job—an average of 13 employees every day. As employers try to curtail those shocking numbers and improve safety throughout their facility, it’s important to examine the relationship between a safer workplace and ensuring uptime, reliability and quality asset performance.
High-pressure injection injuries, also known as grease gun injuries, are caused by the accidental injection of a foreign material–such as grease, oil, or solvent under pressure–through the skin and into the underlying tissue. This is analogous to medical techniques used to administer immunization shots without a needle. A grease gun injury can cause serious delayed soft tissue damage and should be treated as a surgical emergency. Any person sustaining an injury of this sort should seek immediate medical attention, regardless of the appearance of the wound or its size. Accidents involving injection injuries can occur when using any type of pressurized equipment.
High-pressure injection injuries, also known as grease gun injuries, are caused by the accidental injection of a foreign material–such as grease, oil, or solvent under pressure–through the skin and into the underlying tissue. This is analogous to medical techniques used to administer immunization shots without a needle. A grease gun injury can cause serious delayed soft tissue damage and should be treated as a surgical emergency. Any person sustaining an injury of this sort should seek immediate medical attention, regardless of the appearance of the wound or its size. Accidents involving injection injuries can occur when using any type of pressurized equipment.
If you search the Internet for information on asset management, the Internet and Industrial Internet of Things, digitalization, business trends and business reengineering, you’ll find a considerable increase in the number of articles with headlines heralding or promising significant and “disruption” or “disruptive” change. It’s wiser to focus on how to extract value from what you have and spend time creating the vision of where you want to go on the digital journey.
If you search the Internet for information on asset management, the Internet and Industrial Internet of Things, digitalization, business trends and business reengineering, you’ll find a considerable increase in the number of articles with headlines heralding or promising significant and “disruption” or “disruptive” change. It’s wiser to focus on how to extract value from what you have and spend time creating the vision of where you want to go on the digital journey.
Managing your inventory levels correctly can mean the difference between machinery that has broken down and is slowing down the assembly line or a smoothly running machine that is boosting productivity. In today’s competitive industry, no company can afford downtimes and delays in production due to missing parts. With increased competition, companies depend on their supply chain to be leaner, healthier and faster than the competition. The thing to remember about inventory control is that it’s about striking a balance between too much stock and too little. If you have too many tools and spare parts on hand, you’re wasting company funds that could be better utilized elsewhere.
Managing your inventory levels correctly can mean the difference between machinery that has broken down and is slowing down the assembly line or a smoothly running machine that is boosting productivity. In today’s competitive industry, no company can afford downtimes and delays in production due to missing parts. With increased competition, companies depend on their supply chain to be leaner, healthier and faster than the competition. The thing to remember about inventory control is that it’s about striking a balance between too much stock and too little. If you have too many tools and spare parts on hand, you’re wasting company funds that could be better utilized elsewhere.
Maintenance management as an important part of corporate strategy and a profession did not always exist in the form we see it today. It is a concept that has evolved worldwide, especially within the last 50 years with even more glaring advancements happening during the last decade or so. What started as the sole responsibility of engineers and technicians has now grown to become a backbone of business operations as organizations realize the impact maintenance can have on their efficiency and bottom line.
Maintenance management as an important part of corporate strategy and a profession did not always exist in the form we see it today. It is a concept that has evolved worldwide, especially within the last 50 years with even more glaring advancements happening during the last decade or so. What started as the sole responsibility of engineers and technicians has now grown to become a backbone of business operations as organizations realize the impact maintenance can have on their efficiency and bottom line.
So, let’s start with my hypothesis that TPM drives all three elements of OEE, namely: machine availability, speed and quality. Traditionally as a Maintenance Leader and then Operational Excellence (OpEx) leader in paper mills and packaging manufacturing plants, my focus was all about machine availability. If the machine was running, it belonged to operations and I could focus on writing PMs, improving RCM and building Gantt charts for my next planned outage. However, experience has taught me that just focusing on availability is missing 2/3 of the opportunity to improve business by not embracing the entire OEE metric through maintenance action.
So, let’s start with my hypothesis that TPM drives all three elements of OEE, namely: machine availability, speed and quality. Traditionally as a Maintenance Leader and then Operational Excellence (OpEx) leader in paper mills and packaging manufacturing plants, my focus was all about machine availability. If the machine was running, it belonged to operations and I could focus on writing PMs, improving RCM and building Gantt charts for my next planned outage. However, experience has taught me that just focusing on availability is missing 2/3 of the opportunity to improve business by not embracing the entire OEE metric through maintenance action.
Why do components fail? – This article explains common failure mechanisms, component types to which each applies, and suggests non-intrusive monitoring techniques to discover components in various stages of progressive failure.
Why do components fail? – This article explains common failure mechanisms, component types to which each applies, and suggests non-intrusive monitoring techniques to discover components in various stages of progressive failure.
The Environmental Protection Agency (EPA) announced a proposal on April 5, 2023, that will tighten existing rules to further limit the emissions of mercury produced by coal-fired power plants. Coal plants are the largest source of mercury pollution in the United States. In 2017 alone 8,800 pounds of mercury emissions were released.
The Environmental Protection Agency (EPA) announced a proposal on April 5, 2023, that will tighten existing rules to further limit the emissions of mercury produced by coal-fired power plants. Coal plants are the largest source of mercury pollution in the United States. In 2017 alone 8,800 pounds of mercury emissions were released.
In any organization there are many departments that must work closely with other departments. One vital partnership is maintenance and the maintenance storeroom – nothing is more important than getting the right parts at the right time to achieve a high level of maintenance effectiveness. While this partnership is vital, it is difficult to develop and maintain because it requires a high level of discipline and determination by both parties. This article covers the dual responsibilities required to achieve success.
In any organization there are many departments that must work closely with other departments. One vital partnership is maintenance and the maintenance storeroom – nothing is more important than getting the right parts at the right time to achieve a high level of maintenance effectiveness. While this partnership is vital, it is difficult to develop and maintain because it requires a high level of discipline and determination by both parties. This article covers the dual responsibilities required to achieve success.
Japan is known for their high-speed passenger trains, or Shinkansen, the world's most reliable high-speed train network. The key to maintaining the railways spotless record: Dr. Yellow a bright yellow inspection train that uses highly sophisticated condition monitoring equipment to ensure the trains reliability and safety.
Japan is known for their high-speed passenger trains, or Shinkansen, the world's most reliable high-speed train network. The key to maintaining the railways spotless record: Dr. Yellow a bright yellow inspection train that uses highly sophisticated condition monitoring equipment to ensure the trains reliability and safety.
William Santos is the International Sales Manager at ABI Electronics - Manufacturer of Test, Repair & Reverse Engineering Equipment. He had the opportunity to share the mission of "Repair, Don't Waste" with Interesting Engineering. "Repair, Don't Waste" is a movement fighting to reduce e-waste and encourage the repair of industrial electronics. Santos explains why time is up for the break-and-replace mentality, and how the world needs to change to usher in a new era of sustainability in industry.
William Santos is the International Sales Manager at ABI Electronics - Manufacturer of Test, Repair & Reverse Engineering Equipment. He had the opportunity to share the mission of "Repair, Don't Waste" with Interesting Engineering. "Repair, Don't Waste" is a movement fighting to reduce e-waste and encourage the repair of industrial electronics. Santos explains why time is up for the break-and-replace mentality, and how the world needs to change to usher in a new era of sustainability in industry.
In every industry, particularly manufacturing, businesses depend on a diverse array of physical assets to meet customer expectations. Certain assets, while not necessarily the most expensive, are fundamental to the production of goods or services, underlining their significance in operational processes. The disruption of these pivotal assets can trigger a domino effect, disrupting the entire supply chain and potentially halting operations. Therefore, it is imperative for businesses to implement comprehensive maintenance management strategies for these key assets.
In every industry, particularly manufacturing, businesses depend on a diverse array of physical assets to meet customer expectations. Certain assets, while not necessarily the most expensive, are fundamental to the production of goods or services, underlining their significance in operational processes. The disruption of these pivotal assets can trigger a domino effect, disrupting the entire supply chain and potentially halting operations. Therefore, it is imperative for businesses to implement comprehensive maintenance management strategies for these key assets.
Manufacturing organizations are making a change from standard CNC type lathing and milling machines to newer Swiss-style lathes for the production of high-quality parts in large volumes. What are the reasons for the switch? Traditional CNC lathing and milling machines can involve four different setup processes requiring more than one crew member to run, while the more compact and faster Swiss style machines allow operators to process the entire part in one operation.
Manufacturing organizations are making a change from standard CNC type lathing and milling machines to newer Swiss-style lathes for the production of high-quality parts in large volumes. What are the reasons for the switch? Traditional CNC lathing and milling machines can involve four different setup processes requiring more than one crew member to run, while the more compact and faster Swiss style machines allow operators to process the entire part in one operation.
Augmented reality (AR) is emerging as a solution to enhance maintenance programs and mitigate the technician shortage. AR for maintenance has the potential to transform organizations' maintenance programs by improving maintenance efficiency and accuracy in a time when skilled technicians are in high demand.
Augmented reality (AR) is emerging as a solution to enhance maintenance programs and mitigate the technician shortage. AR for maintenance has the potential to transform organizations' maintenance programs by improving maintenance efficiency and accuracy in a time when skilled technicians are in high demand.
The surge in battery manufacturing in the US, fueled by a significant investment of up to $3.5 billion from the Infrastructure Law, marks a pivotal step towards achieving a net-zero emissions economy by 2050 and a notable shift towards electric vehicles. The funds are set for upgrading facilities, creating well-paid union jobs, and establishing a robust domestic supply chain. What new technology is being applied? How do we keep manufacturing personnel safe in these facilities?
The surge in battery manufacturing in the US, fueled by a significant investment of up to $3.5 billion from the Infrastructure Law, marks a pivotal step towards achieving a net-zero emissions economy by 2050 and a notable shift towards electric vehicles. The funds are set for upgrading facilities, creating well-paid union jobs, and establishing a robust domestic supply chain. What new technology is being applied? How do we keep manufacturing personnel safe in these facilities?
The last of the ‘baby boomer’ generation are now retiring from the workplace. As they walk out of the door of your business for the last time, they are taking with them a lifetime's experience from old-school apprenticeship programmes to a lifetime of fault diagnosis and learning in the ‘university of life.’ That experience is what helped your business grow, become successful, and kept your customers happy and returning with repeat orders! So, what can be achieved in the time before valued employees retire for knowledge capture and knowledge transfer so your business can maintain momentum?
The last of the ‘baby boomer’ generation are now retiring from the workplace. As they walk out of the door of your business for the last time, they are taking with them a lifetime's experience from old-school apprenticeship programmes to a lifetime of fault diagnosis and learning in the ‘university of life.’ That experience is what helped your business grow, become successful, and kept your customers happy and returning with repeat orders! So, what can be achieved in the time before valued employees retire for knowledge capture and knowledge transfer so your business can maintain momentum?
Asset Managers are expected to provide an annual budget and periodic cost reporting against that budget. Traditionally creating a budget has been mostly guesswork and is justified by previous year’s budgets with an inflation adjustment. There is no opportunity for improvement, and often senior management will request cost cutting due to economic conditions, making it difficult for the maintenance manager to argue a case for maintaining their budget. A better approach that supports continuous improvement and enables the maintenance manager to control and justify costs is to use zero-based budgeting in SAP.
Asset Managers are expected to provide an annual budget and periodic cost reporting against that budget. Traditionally creating a budget has been mostly guesswork and is justified by previous year’s budgets with an inflation adjustment. There is no opportunity for improvement, and often senior management will request cost cutting due to economic conditions, making it difficult for the maintenance manager to argue a case for maintaining their budget. A better approach that supports continuous improvement and enables the maintenance manager to control and justify costs is to use zero-based budgeting in SAP.
Condition-based maintenance (CBM) is a maintenance strategy that focuses on monitoring the condition of equipment to determine when maintenance actions should be performed. While CBM can be effective in reducing unplanned downtime and optimizing maintenance activities, it alone does not address the root causes of failure and may not lead to long-term improvements in machine reliability. Here are a few reasons why CBM, on its own, may not improve reliability.
Condition-based maintenance (CBM) is a maintenance strategy that focuses on monitoring the condition of equipment to determine when maintenance actions should be performed. While CBM can be effective in reducing unplanned downtime and optimizing maintenance activities, it alone does not address the root causes of failure and may not lead to long-term improvements in machine reliability. Here are a few reasons why CBM, on its own, may not improve reliability.
Offshore wind farms are an integral part of the changeover to renewable energy. What are the benefits of building more offshore wind farms? What are the risks and difficulties faced in opening and operating the farms? What are best practices for reliability and maintenance in offshore wind farms? What are basic safety guidelines for personnel working on offshore wind farms?
Offshore wind farms are an integral part of the changeover to renewable energy. What are the benefits of building more offshore wind farms? What are the risks and difficulties faced in opening and operating the farms? What are best practices for reliability and maintenance in offshore wind farms? What are basic safety guidelines for personnel working on offshore wind farms?
Maintenance workers, especially those responsible for the upkeep of industrial machinery, face many workplace hazards, from strains, sprains, and tears to lacerations and fractures. Fortunately, numerous innovations have been developed in the maintenance safety world to reduce the risk of accidents and injuries, including those discussed in detail in this guide.
Maintenance workers, especially those responsible for the upkeep of industrial machinery, face many workplace hazards, from strains, sprains, and tears to lacerations and fractures. Fortunately, numerous innovations have been developed in the maintenance safety world to reduce the risk of accidents and injuries, including those discussed in detail in this guide.
Picking a solution to properly heat your facility can be tough. Do you go with a spot heating solution or a space heating solution? When deciding on the heating solution for your facility, it’s important to consider the type of fuel source that is required to power the unit. This should be determined by the space you are trying to heat, the climate, and the region where you operate.
Picking a solution to properly heat your facility can be tough. Do you go with a spot heating solution or a space heating solution? When deciding on the heating solution for your facility, it’s important to consider the type of fuel source that is required to power the unit. This should be determined by the space you are trying to heat, the climate, and the region where you operate.
Do we really have to talk about this? Maximo has had Inventory Management functionality for many, many years. Not only is the function present, but it interconnects to many of the other Maximo modules such as Purchasing and Work Management.
Do we really have to talk about this? Maximo has had Inventory Management functionality for many, many years. Not only is the function present, but it interconnects to many of the other Maximo modules such as Purchasing and Work Management.
Oh, the exciting world of software validation! Hours and hours of white-knuckled test development, execution, and… as if those are not enough… resolution and documentation of the results! Then of course are the continued change management efforts needed to keep the system in a validated state over its lifecycle. It takes truly special people to function in this arena.
Oh, the exciting world of software validation! Hours and hours of white-knuckled test development, execution, and… as if those are not enough… resolution and documentation of the results! Then of course are the continued change management efforts needed to keep the system in a validated state over its lifecycle. It takes truly special people to function in this arena.
Though new leadership models are constantly coming in and out of fashion, when it comes to leadership of continuous improvement it is important to look behind the latest book or trend, deeply reflect on the true roots of CI Leadership and ask yourself “Am I prepared for the challenges of CI leadership in 2024 and beyond?”
Though new leadership models are constantly coming in and out of fashion, when it comes to leadership of continuous improvement it is important to look behind the latest book or trend, deeply reflect on the true roots of CI Leadership and ask yourself “Am I prepared for the challenges of CI leadership in 2024 and beyond?”