Data Analysis Tip 1 – Consider the Machine First and Then the Graphs
www.dliengineering.com
After reading this data analysis tip be sure to read Read Tip #2 and Tip #3!
Tip #1: Consider the Machine First and then the Graphs
A common approach to looking at vibration spectra is to display the graphs and then ask “What is wrong with this machine?”
Another common approach to analyzing vibration spectra is to display the graphs and then ask “What is this peak?” and “What is that peak?”
A much better approach to analyzing data than the two approaches listed prior, is to stop, take a minute, and ask yourself these 3 important questions:
“What faults can this machine have?”
“Which of these are most common for this machine?”
“How do these faults present themselves?”
As a matter of fact, these questions should really be asked before the machine is even tested. Asking these questions prior to testing is recommended because it may turn out that vibration analysis isn’t even the appropriate technology to use to find the most common faults in this machine.
A good exercise is to draw a simple schematic of the machine including test points and internal components, then write down a list of the most common faults the machine may experience. Between the diagram and a vibration text book or reference chart, you can now describe what peaks and patterns in each test point will coincide with each fault. Finally, go down the list of faults and patterns and check the data to see if it contains any of these patterns or not.
Did you enjoy this tip? Read Tip #2 or Tip #3
Do you have a tip you’d like to share with the Maintenance World community? Submit it to info@idcon.com today to be featured in your favorite publication!
Related Articles

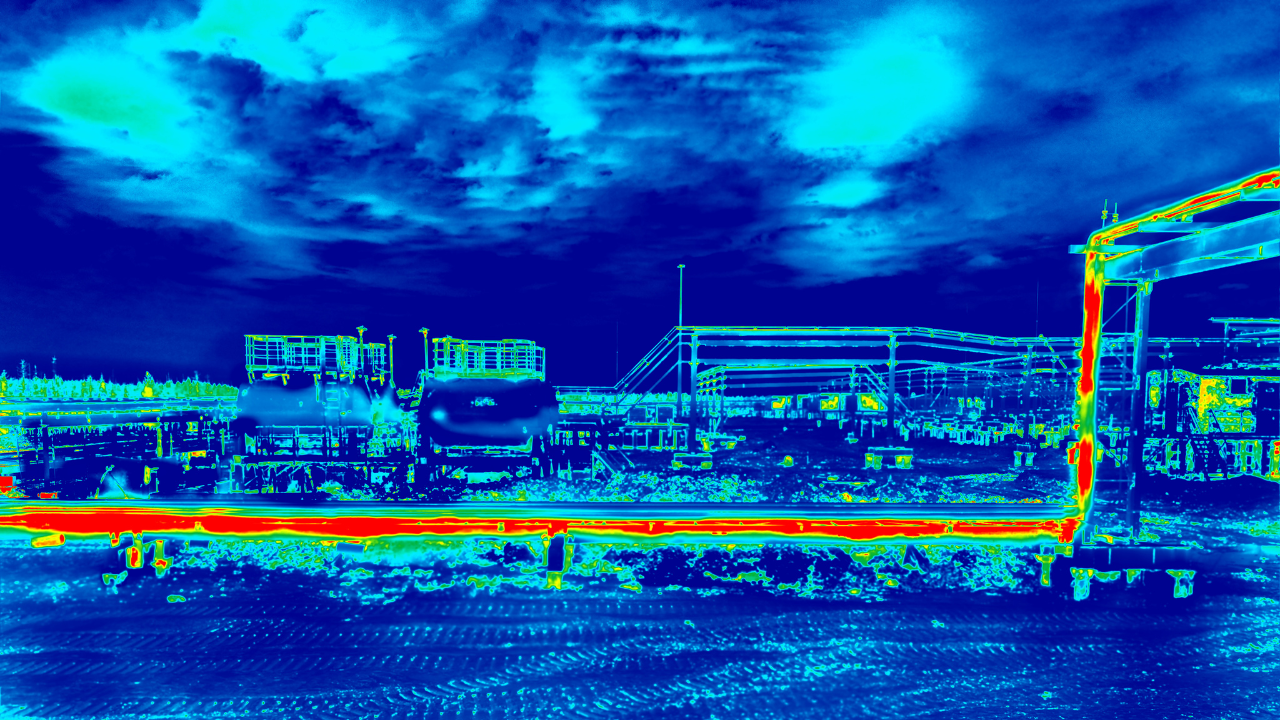
Solving Electrical Problems with Thermal Imaging
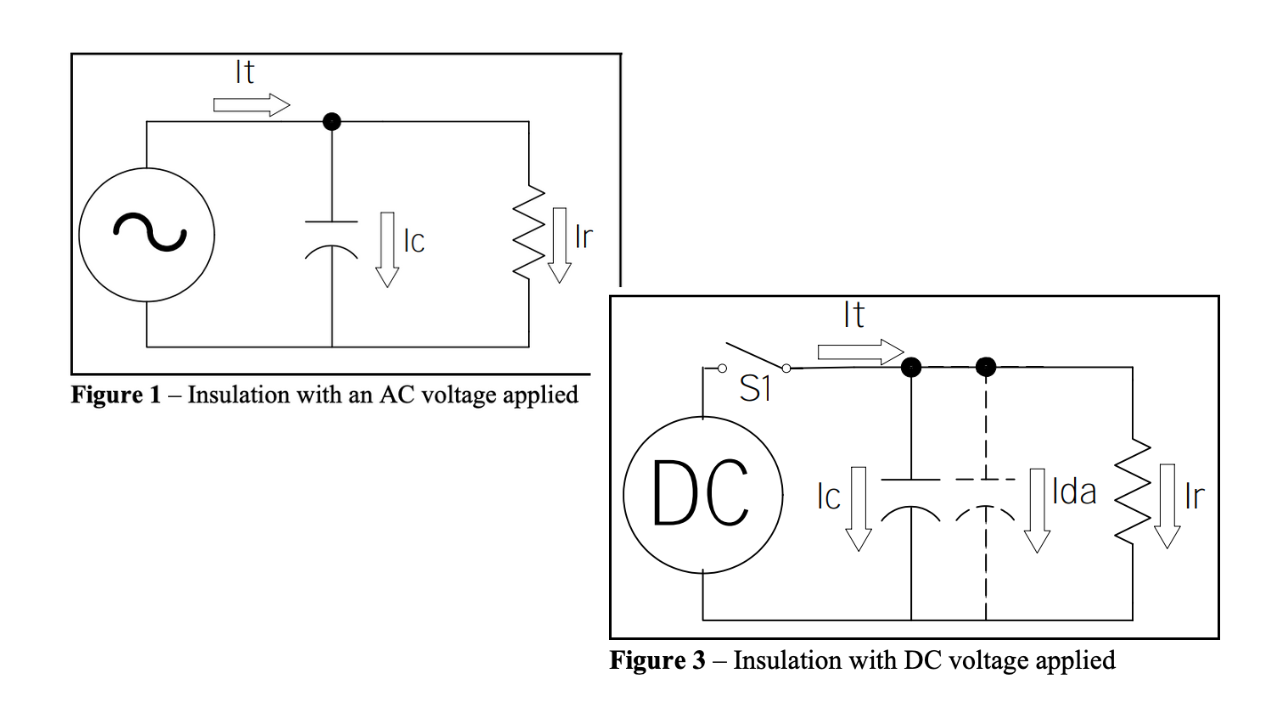
Principles of Insulation Testing

Understanding The Basics Of Balancing & Measuring Techniques

Essential Vibration Analysis Tips - All About Sheaves
Implementing an IR Thermography Maintenance Program

Why Record? Infrared Video