Gearbox Diagnostics Fault Detection
Walter Bartelmus
Abstract
The paper deals with the method of gearbox diagnostics fault detection, and shows that using: design, production technology, operational, change of condition (DPTOCC) factors analysis leads to the inference of gearbox diagnostic information.
In the paper is a review of the current possibilities for using mathematical modeling and computer simulation for investigating the dynamic properties of gearbox systems. Computer simulation of dynamic behavior of gearboxes is a powerful tool for supporting gearbox diagnostic inference.
The paper shows that for gearbox fault detection, many different ways of signal analysis should be done. In the paper it is suggested that for fault detection: time trace, spectrum, cepstrum and time-frequency spectrogram examination has to be used. It has been shown that using these ways of vibration signal analysis there are possibilities to detect signal faults and distributed faults in gearboxes. A signal fault is caused by a tooth crack/fracture and breakage, a spall in a gearing or in an inner or outer race of a bearing, a spall on a rolling element of a bearing; distributed faults are caused by uneven wear (pitting, scuffing, abrasion, erosion).
Computer simulation enables one to infer that the cepstrum not only detects single gearing faults, but also distributed faults. It has been pointed that for explicit detection of a tooth fracture and breakage there is a need to use a cepstrum and a time-frequency spectrogram.
The given consideration is also based on industrial experience of the author of using condition monitoring for double stage gearboxes. The gearboxes of power 630 and 1000 kW are used for driving belt conveyors.
1. Introduction
Diagnostics is understood as identification of a machine’s condition/faults on the basis of symptoms. Diagnosis requires a skill in identifying machine’s condition from symptoms. The term diagnosis is understood here similarly as in medicine.
It is generally thought that vibration is a symptom of a gearbox condition. Vibration generated by gearboxes is complicated in its structure but gives a lot of information. We may say that vibration is a signal of a gearbox condition. To understand information carried by vibration one have to be conscious/ aware of a relation between factors having influence to vibration and a vibration signal.
Let me refer to some publications giving more details on the discussed subject. In [1] the factors having influence to a vibration signal are divided into four groups: design, production technology, operational, change of condition (DPTOCC). As it is suggested in [1]:
Design factors include specified stiffness of the gear components, especially flexibility of gearing, and specified machining tolerance (errors) of components. Design factors are given in element/part drawings.
Production technology factors include deviations from specified design factors acquired during machining and assembly of the gearboxes.
Operational factors include peripheral speed (pitch line velocity) and its change, and outer load and its change
Condition change factors include condition of bearings and gearbox gearing and shafts. For gearing we have signal faults (cracking/fracture, breakage) and distributed faults, pitting, scuffing, erosion. For bearings we have signal faults (spalling, pitting, erosion) occurring on bearing’s races and rolling elements. The bearing elements undergo also abrasive wear causing bearing elements dimensions change.
2. Influence of DPTOCC factors to Vibration Diagnostic Signals
All design factors are specified in design drawings. The design factors connected with gear dimensions are transformed into dynamic model parameters like it is given for example in Fig.1 for a two-stage gearing system with electric motor and driven machine. The system consists of: rotor inertia Is, gear inertia of first stage I1p, I2p, gear inertia of second stage I3p, I4p, driven machine inertia Im, gearing stiffness kz1 kz2 and shaft stiffness k1; k2; k3, damping coefficient of a flexible couple C1.
The manifestation of gear dimensions (model parameters) in diagnostic signals are vibration components coming from natural vibration of a gearbox system. Frequencies of these components are independent of a system rotation. When the frequency of natural vibration equals to the frequency of excitation caused for example by machining/ gearing a system runs at resonance. Some natural components in a vibration time trace signal are manifested during a starting of gearbox systems.
As it is given in Fig.2 in the period (1) in which a gear rotation increases from 0 to 980rpm. Fig.2 shows in the period (time within 0 -1.7s) local maxims of a vibration signal. The plot given in Fig.2 can be divided into four periods: first period, a starting of a system and connected with it change of system rotation from 0 to 980rpm, within time 0 – 1.7s; second period within time 1.7 – 2.1s, free system rotation; third period within time 2.1 – 2.6s, linear increase of outer gearbox load; fourth period within time 2.6 – 5s, run of the system under steady outer load.
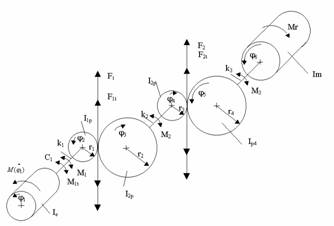
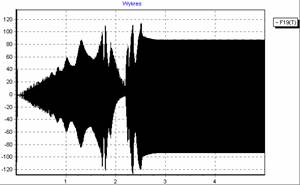
Fig.2 Relative reference acceleration [m/s2] is a function of time [s] at gearing condition given by error function E(0.5,10,0) and =0.02; 1 – period of system rotation increase; 0 – 1.7s; 2 – free rotation of system, 1.7 – 2.1s; 3 – period of linear outer load increase 2.1 – 2.6s; 4 – rotation under steady load 2.6 – 5s
In the gearing drawings limits for machining errors of gearing are specified, for condition simulations error function/mode is defined as three parameter function E(a, e, r). The error trace for two co-operating gears – gearing is given in Fig3. In Fig.3 we see influence of tooth to tooth error and influence of wheel eccentricities. Fig.4 gives the time trace of tooth to tooth errors used in mathematical modelling and computer simulation. In Fig.4 meaning of a, e, r parameters are clarified. Parameters a and r can be chosen between 0 and 1. As it is seen in Fig.3 that the gearing error function is a sum of error function E(a, e, r) plus wheel’s eccentricities and it may be expressed by an error function
Eb = E(aux,a,e,r) + b1sin( 2) + b2sin( 3) (1)
where:
b1, b2 wheel eccentricities in [m]
2, 3 rotation angels in [rad].
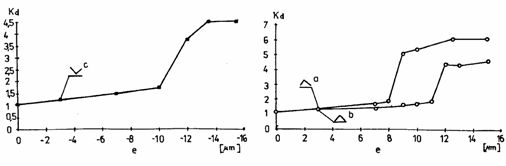
An example of influence of design and condition change factors described by parameters of the error function a, e is given in Fig.5. Influence of error function parameters a, e, r and a damping coefficient C1 is given in [3].
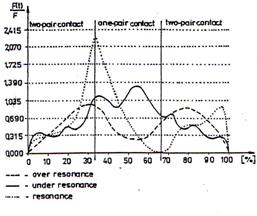
Investigations on influence of operational factors on vibration are given in Fig.6 and 7. An operational factor may be rotation speed in rpm of gear wheels. So the system may run under resonance, at resonance, an over resonance as it is given in Fig.6. In Fig.8 is given influence of gearing errors (production technology factor) to inter-tooth force which have direct influence to vibration generated by a gearing. The influence is caused by change of max error value e from 10 to 15 m. Results given in figures 7 to 8 were obtained for a system with one stage gearbox.
Further results of computer simulations for investigation on influence condition change factors on the signal generated by gearing and the results of signal analysis taken by measurements from real gearboxes are given in publications [2] to [5]. The condition of a gearing is characterised by signal faults given by a tooth fracture or breakage or distributed faults caused by gearing and bearing wear: pitting, scuffing, erosion. Here will be given some analysis of condition change of a system with double stage gearboxes using computer simulation and for vibration measurements more details are given [5].
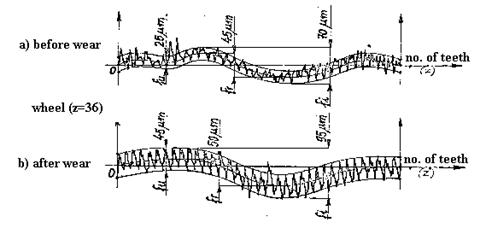
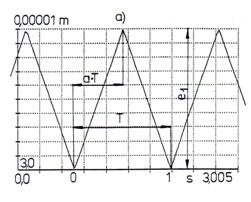
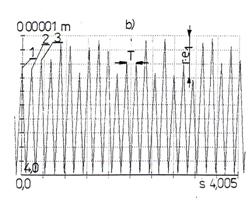
Fig.4 a) Error function for error mode E(0.5, 10, 0), a=0.5, e1=10mm., r=0; b) Plot of error function for E(0.5, 10, 0.3), a=0.5, e1=10mm, r=0.3, [3]
a) b)
The best way of mathematical presentation of influence of design, production technology and change of condition factors is a statement describing an inter-tooth force F=kz(aux,g)(max(r1 2-r2 3-lu+Eb ,min(r1 2 – r2 3 +lu+Eb,0))) (2)
where Eb is given by (1)
lu inter tooth backlash
functions max and min are defined as follow
min(a,b) for which if a<b then min=a else min=b
max(a,b) for which if a>b then max=a else min=b
aux – auxiliary value gives position of a wheel.
Substituting Eb into equation for F we obtain the description of influence mentioned factors on the inter-tooth force generating vibration which is a signal of a gearing condition.
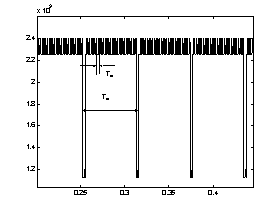
For modelling of a local fault the time trace of the stiffness change for the case of local fault caused by the crack is given in Fig.9 together with its spectrum and detail of the spectrum Fig.10.
a)
b)
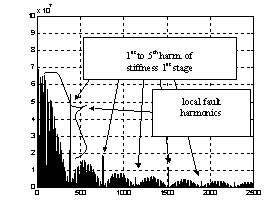
Fig.9 Time stiffness trace [s] with local fault (tooth breakage) with stiffness drop to 0.5kz and its spectrum in [Hz]
The detail from the spectrum given in Fig.9 is presented in Fig.10.
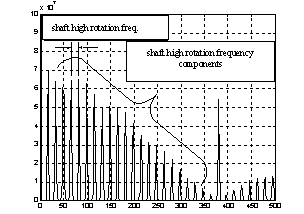
In Fig.9 and 10 are seen frequency components connected with a shaft rotation fo1 its harmonics and
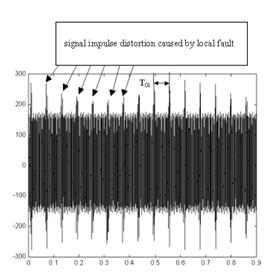
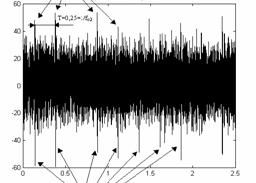
z1 fo1 mashing frequency its components, where z1 – pinion teeth number.The normal maximum value of stiffness is kz and normal fluctuation of stiffness is 0.06kz the drop of stiffness caused by a crack is 0.5kz. The parameter of stiffness function change g=0.06 is given in (2) by kz(aux,g). Parameter g is a measure of stiffness drop caused by two teeth and one tooth gearing co-operation. A time trace vibration signal received from the first stage with the local fault D kz1 =0,5kz1 and reference errors E(a1=0.5; e1=20; r1=0) is given in Fig.11. The time trace acceleration [m/s2] signal is a function of time [s].
a)
b)
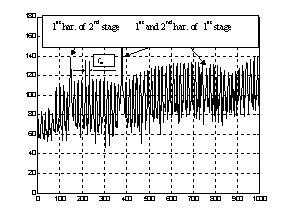
Fig.12a) Linear spectrum [Hz] from signal caused by reference gearing error E(a1=0.5; e1=20; r1=0) and local fault D kz1 =0,5kz1 b) Decibel spectrum from signal caused by reference gearing error E(a1=0.5; e1=20; r1=0) and local fault D kz1 =0,5kz1
A linear spectrum from signal caused by a reference gearing error E(a1=0.5; e1=20; r1=0) and local fault D kz1 =0,5kz1 together with its decibel spectrum is given in Fig.12.a) and b). For local fault detection is recommended cepstrum analysis given in Fig.13. The cepstrum is a function of time [s] is given in Fig.13 for three different gearing conditions defined by a local fault and the reference error function. In Fig.13 it is seen that with increase of a fault/crack capstrum components are increasing. In a gearing may also occur distributed gearing faults caused by gearing wear, pitting, scuffing, erosion. The case of distributed faults is considered in [5]. Computer simulation investigations on influence of distributed faults to cepstrum show that cepstrum is also a measure of distributed faults.
a) 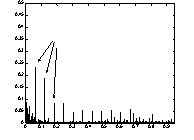 b)
b) 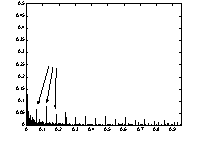
c) 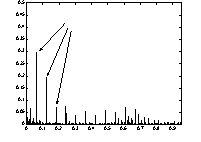
Fig.13 a) Signal’s cepstrum for reference gearing error E(a1=0.5; e1=20; r1=0) and local fault D kz1 =0,5kz1, b) Signal’s cepstrum for reference gearing error E(a1=0.5; e1=20; r1=0) and local fault D kz1 =0,1kz1, c) Signal’s cepstrum for reference gearing error E(a1=0.5; e1=20; r1=0) and local fault D kz1 =0,9kz1
a)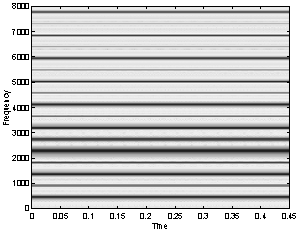
b)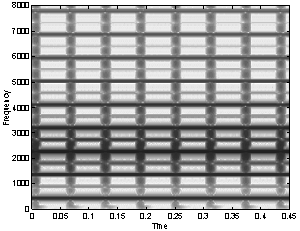
Fig.14 Time frequency spectrograms for a) for signal without signal fault and b) with signal fault.
For explicit identification of signal gearing fault there is a need of additional signal analysis as is given in Fig.14. Fig.14 a) shows a time frequency spectrogram for signal without a signal fault. Fig 14 b) shows a spectrogram with a signal fault. In Fig.14 a) there are only seen horizontal lines showing meshing frequencies and its components. Fig.14 b) shows additionally vertical lines separated by a time period equivalent a rotation time of a gear wheel with a signal fault.
Taking into consideration given example and results given in [5] the influence of condition change factors of gearing for double stage gearboxes is given for local faults, for wheel eccentricities and distributed faults.
In the spectrum given in Fig.12 we see spectrum components connected with gearing frequency nz/60 and its harmonics where n [rpm]; z – number of teeth. As considered these harmonics are the measure of gearing stiffness change and the measure of tooth errors and with their increase we can see change in harmonic intensity. In the spectrum of a gearing fault function Fig.9b we see that first harmonic has the biggest intensity. In vibration spectrum Fig.12a we see transformation of components and the biggest intensity has third spectrum component. This transformation is caused by influence of design factors, in a system with a gearbox by parameters (Is, I1p, I2p and so on look Fig.1.
Almost all considered factors are modelled by modification of inter-tooth force given by (2). The modelling of bearing conditions, described in [5], is obtained by application of additional forces caused by bearing faults.
The chapter shows us a relation between DPTOCC factors and a vibration signal generated by a gearbox system. This relation leads to inferring gearbox diagnostic information.
The inferring gearbox diagnostic information is used for gearbox condition assessment.
3. Measured signal analysis final consideration
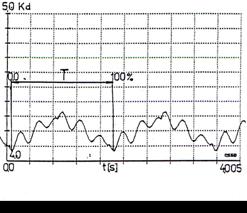
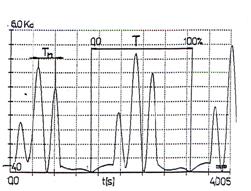
In the case of a tooth crack a series of peaks is visible in the signal trace as in Fig.11 or 15. The peaks are separated by equal time period T. Peaks indicate a single gear fault as it is described in chapter 2.
A spectrum for a gearing with a local fault shows meshing frequency fz and its multiples and noise-like components due to a local fault Fig.12. Using a cepstrum analysis we obtained results as given in Fig.16. In Fig.16 there are given three results obtained from three signals received from three different points on gearbox housing. The results are similar because a cepstrum analysis eliminates influence of a signal path to the results.
More detailed examination of noise like components are made as suggested in [5] by a time frequency spectrogram and is given in Fig.14. Horizontal lines representing meshing frequency components can be seen in a spectrogram for a gearing without a local fault, Fig.18a. In the spectrogram for the signal with a local fault also vertical lines with a time period equivalent to the period of gear fault revolution/repetition are visible, Fig.17b.
This chapter shows that results obtained by computer simulation helped in interpretation of results of real signals.
a) 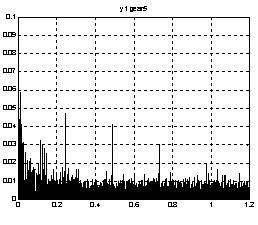 b)
b)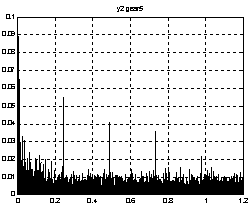
c)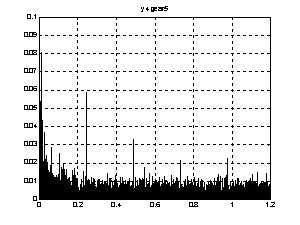
Fig.16 Cepstrums for signal received from three diffrent points for gearbox mark 5
a) 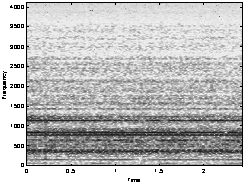 b)
b)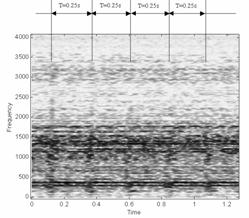
Fig.17 Time-frequency [s]-[Hz] spectograms a) spectogram of signal without regular peaks b) spectogram of signal with regular peaks.
4. Gearbox diagnostic method and final consideration
Following description given in [1] first an overview of a diagnostic method used for double-stage gearboxes is described here next the advanced diagnostic method will be developed. The method giving in [1] is based on wide band signal analysis. This method was used when only some rough description of relation between the DPTOCC factors and vibration signal was available and some simple instruments for vibration measurements were used.
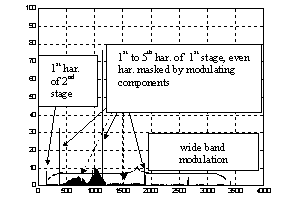
The signal of vibration is divided into three spectrum bands. According to chapter [1] the following attributes have been taken for gear diagnostics:
Operating conditions of the high rotation shaft of the gear should be reflected by a wall vibration averaged velocity attribute v mm/s in frequency range (10-100Hz).
Operating conditions of gearing should be determined by averaged values of velocity v [mm/s] and acceleration a m/s2 within the frequency range (3.5-10kHz)
Operating conditions of rolling bearings should be reflected by acceleration attribute a [m/s2] within the frequency range (3.5-10kHz).
The given above method can give only the rough evaluation of gearing condition. There is no possibility to evaluate the early change of gearing condition caused by the early stage of wear caused by pitting or scuffing and is no possibility to detect a local fault caused by a tooth cracking/fracture. By using the mentioned method we can not separate gearing faults coming from two deferent gearbox stages. We can’t separate local faults and distributed faults. So a new more advanced method based on knowledge gained from computer simulations and real measured signal analysis is needed.
The new method takes into account considerations given in chapter 2 and in publications [2] to [4] and monograph [5]. The wide band method is easy to use for on-line condition monitoring. The detailed condition assessment of a gearbox may be done using off-line additional signal analysis.
The method has to take into consideration the scenario of gearbox condition change here is taken typical scenario occurring in surface mines. The scenario of the gearboxes deterioration is as follows: Gearboxes work in heavy environment conditions and very fine particles of sand get inside housings of the gearboxes and cause abrasive wear of gearbox bearings.
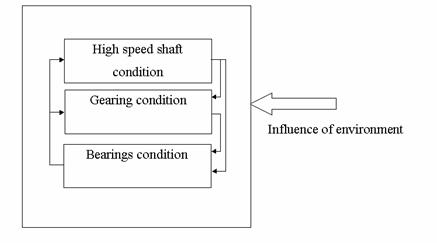
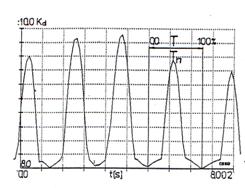
The bearings in that condition have influence to the gearing co-operation and cause increase of inter-teeth vibration (acceleration). For the additional evidence of condition change caused the bearings abrasive wear y coefficient given by (3) should be calculated. The check consists in determining the slope of a straight line (look Fig.5) in the linear relation by calculating the coefficient
= ( – )/(I1 – I2) m/(s2A) (3)
where , – mean values of accelerations for signal within a band of 100¸3500 Hz for respectively: a load of about 0.85In and 0.5In; In – rated electric current value [A]; I1, I2 – values corresponding to the smaller and greater load, respectively.
The interaction of gearbox element condition is according to Fig.18. The sequence of condition change is as follows: influence of mine environment, abrasive wear of bearings, change of co-operation in gearing, change of gearing condition, pitting or scuffing of teeth. The abrasive wear of bearings has also influence to a high rotation/speed shaft (shaft driven by an electric motor) working condition. In the former method gearing condition is described by the gearing co-operation classification, in succession B, C look [1]. Further dramatic change of the gearbox condition is ‘knocking out’ rolling bearing seatings, unstable run of gearing. Function of Kd given in Fig.8 is equivalent to gearing condition co-operation for class D. In [1] is recommended that replacement of a gearbox ought to be done when gearing condition is in class B (averaged vibration within 30 and 45 m/s2). Replacement of a gearbox when vibration is within class B is recommend as ‘economic replacement’. As it was mentioned the method described in [1] can not detect the early change of gearing condition.
The early stages of gearing condition change can be detected by new ways of signal analysis obtained by cepstrum. Full description of use of cepstrum analysis is given in chapter 2 and in [5]. The gearing condition change is caused by pitting or scuffing, erosion. The pitting scuffing and erosion cause distributed faults. The separated rahmonics in cepstrum can be distinguished for gearbox stages. Besides of distributed faults there are signal faults caused by a tooth crack/fracture or breakage of a tooth Fig.13. For explicit detection of a tooth crack/fracture or breakage cepstrum and time-frequency spectrogram signal analysis in an advanced method is used and given in Fig.14 and 17.
In the former method [1] there is not possibility to detect such change of a gearing condition. There was not clear interpretation/relation between gearing condition and vibration signal. There was a tendency of the diagnostic system user to make a replacement decision when a vibration level is for gearing condition in class C (averaged vibration within 45 and 70 m/s2), it is termed as necessary replacement of a gearbox. This tendency causes increase of funds for gearbox repairs.
Finally we may come to conclusion that joined inference which coming from consideration given in the method description [1] and new findings presented here and more in the monograph [5] should be taken during a gearbox system diagnostic assessment. The condition of gearboxes may be interpreted as it was given in the wide band vibration method and using new ways of signal interpretation more evidence for gearing condition is obtained.
It is recommended to use the wide band method for on-line condition monitoring and off-line condition monitoring may be used when signal comes to the level of class B for detailed evaluation of a gearbox condition change.
One should mention that using recommendations given in ISO 3945, measurement of velocity within 10 -1000Hz and Canadian standard CDA/MS/NYSH 107 measurement of acceleration within 10 -10000Hz we may have some troubles with gearbox condition evaluation. It is recommend using signal filtration in mentioned above bands.
Literature
[1] Bartelmus W.: Vibration condition monitoring of gearboxes. Machine Vibration 1992 nr1 s.178-189.
[2] Bartelmus W.: Transformation of gear inter teeth forces into acceleration and velocity. Conference Proceedings of The 7th International Symposium on Transport Phenomena and Dynamics of Rotating Machinery Hawaii USA 1998. i w International Journal of Rotating Machinery 1999 Vol.5. No.3 s.203-218
[3] Bartelmus W.: Mathematical Modelling of Gearbox Vibration for Fault Diagnosis, International Journal of COMADEM, Vol.3, no.4, 2000
[4] Bartelmus W. Mathematical Modelling and Computer Simulations as an Aid to Gearbox Diagnostics. Mechanical Systems and Signal Processing 2001 Vol.15, nr5, s. 855-871
[5] Bartelmus W.: Computer-aided multistage gearbox diagnostic inference by computer simulation. Scientific Papers of the Institute of Mining of Wroclaw University of Technology. No.100, 2002
Wroclaw University of Technology, Poland
Related Articles

Condition Monitoring Tools: Be Creative
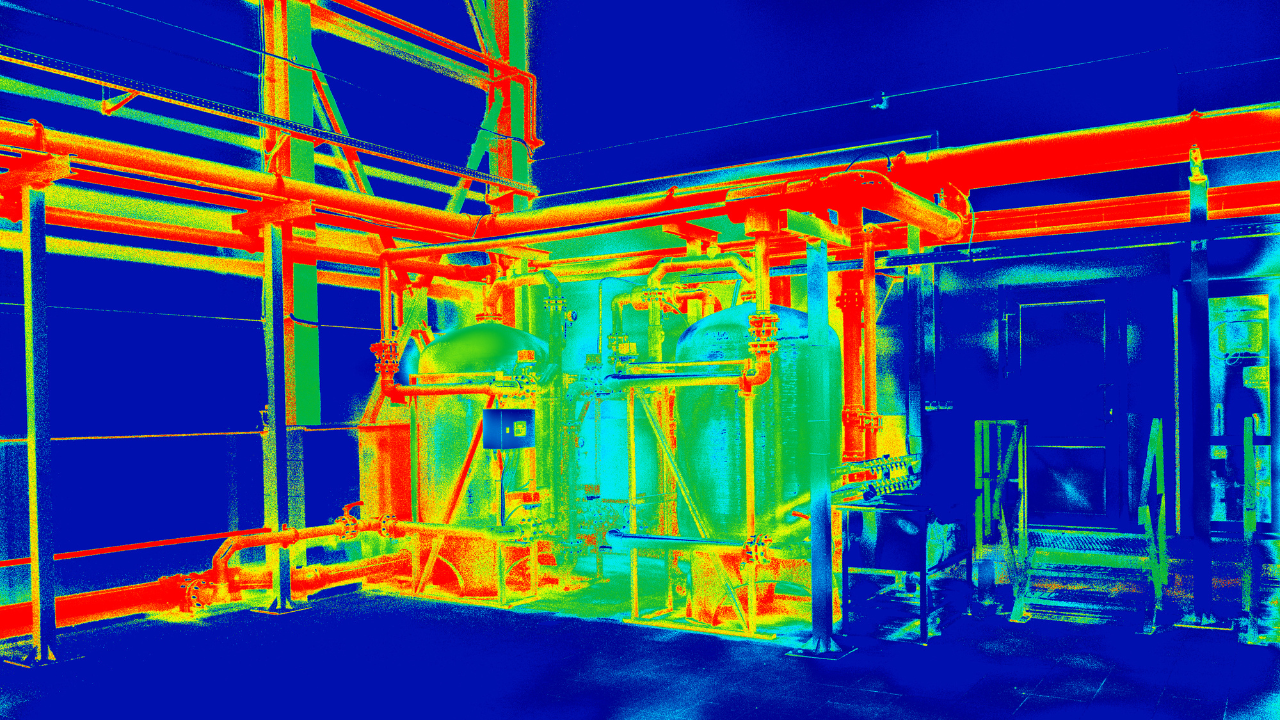
Infrared Thermography
Bearing Life: Condition Monitoring, Care, and Cleanliness

2025 Maintenance Technician Tools: A CMMS System for Total Maintenance

How to Use Condition Monitoring to Optimize Grease Lubrication

Data Analysis Tip 2 – Create a Vibration Test and Analysis Guide