Online Condition Monitoring Reaps Benefits for Borealis
ME Plant and Maintenance Magazine
Click here to download the full pdf.
ME Plant and Maintenance Magazine
Related Articles

Data Analysis Tip 1 – Consider the Machine First and Then the Graphs
A common approach to looking at vibration spectra is to display the graphs and then ask “What is wrong with this machine?” Another common approach to analyzing vibration spectra is to display the graphs and then ask “What is this peak?” and “what is that peak” A better approach to analyzing data is to first ask “What faults can this machine have?”, “Which of these are most common for this machine?” and finally...

Define and Measure KPIs and Goals for Condition Based Maintenance
Condition based maintenance offers a large array of benefits if done correctly. It is not enough however to know we are doing a good job. We have to be clear about our goals and we have to be clear about how we are going to measure if we are meeting our goals or not. There are all sorts of fancy software platforms with dashboards that can help us define and measure KPIs, and track and visualize them, but we have to actually use them!

Beyond the Usual Applications for Infrared Thermography
There are many uses for infrared thermography other than inspecting electrical switchgear and mechanical components. Inspecting buildings for heat loss was one of the first commercial uses for infrared thermography.

Data Analysis Tip 3 – Compare Identical Machines
When troubleshooting or using vibration in a Predictive Maintenance program comparing identical machines to each other is often the best method to diagnose a problem – especially if you suspect a problem exists in one or more of the machines. When vibration data is collected on a bearing housing using an accelerometer, one is not only measuring vibration forces, but also the effect of the structure on these forces.

Visual Inspection: A Necessary Component of Infrared Inspections
It may seem that visual inspection goes beyond what thermographers are hired to do, but conscientious thermographers include notes and even images in their reports when they see code violations, broken equipment, incorrectly sized fuses, bad wiring, etc. A good thermographer will not ignore copper tubing used as a fuse, even if it looks fine in the infrared. Whether the inspection is insurance driven or a proactive stance, an infrared inspection and a visual inspection complement each other.

Does Condition Based Maintenance (CBM) Improve Reliability?
Condition-based maintenance (CBM) is a maintenance strategy that focuses on monitoring the condition of equipment to determine when maintenance actions should be performed. While CBM can be effective in reducing unplanned downtime and optimizing maintenance activities, it alone does not address the root causes of failure and may not lead to long-term improvements in machine reliability. Here are a few reasons why CBM, on its own, may not improve reliability.
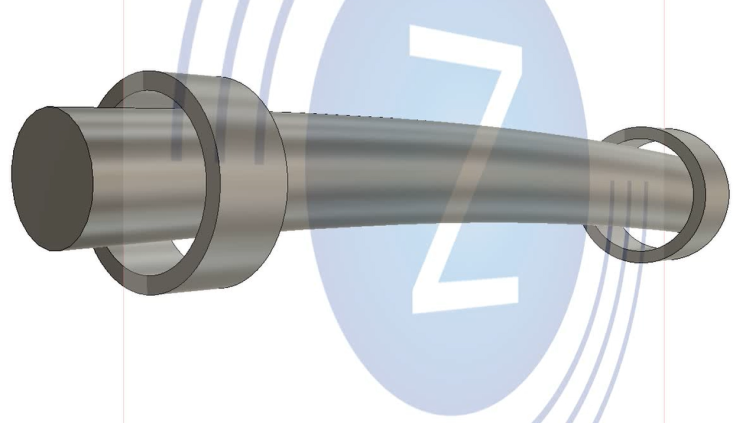
Diagnosing a Bent Shaft
Diagnosing a bent shaft with vibration analysis is easy to do, especially when you can visualize its movement using 3D animations. Vibration patterns for different faults can look similar to each other. This is why it is always best to start with the machine, consider what faults are most likely and then take data in the proper test points and axes to find the most likely faults. It can get complicated, but 3D animations make it easier to visualize what is going on.