Condition Monitoring Based on Acoustic Emission
Trevor Holroyd
When we talk about machinery condition monitoring, we’re talking about condition in the sense of a machines ability to continue to perform its intended function in an efficient manner. Unfortunately there is no way to directly measure machine condition and so it is necessary to infer it from indirect measurements. For Condition Monitoring (CM) purposes a range of technologies are available, each having its own strengths and weaknesses, and it is usual to consider each of them as a tool in the CM toolkit. The Acoustic Emission (AE) technique has a 40 year history of use for machinery condition monitoring and although it got off to a slow start, in recent years it has gained very widespread acceptance across industry. The particular strength of Acoustic Emission is its ability to directly detect the processes associated with wear and degradation (including friction, impacts, crushing, cracking, turbulence, etc,). It does this by detecting the surface component of stress waves that these processes invariably generate. These stress waves travel all over the machines surface, which means that sensor positioning is not critical.
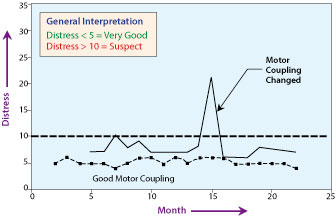
Another convenient feature of Acoustic Emission signals is that they generally have a high Signal to Noise Ratio (SNR), which means that the signals related to machine condition can be clearly seen and are not buried in other inconsequential signals. This is a direct consequence of the high frequency and resonant nature of an Acoustic Emission sensors response. An example of an application that makes full use of this high SNR is the monitoring of blowers in a blower house. This application environment involves very high noise and vibration levels with adjacent identical blowers cutting in and out in response to process demands without warning. Despite this, clear trends of processed Acoustic Emission signals have successfully identified a number of faults including defective motor coupling (see Figure below showing good and bad examples) and build up of lime on the rotors enabling wash initiation and avoidance of rotor collision. The high and variable background noise together with the problems of cross-talk and sympathetic resonance from adjacent blowers prevents the successful use of Vibration techniques in this application.
Acoustic Emission sensors, signals and technology have little in common with those of the Vibration technique and this has many positive consequences in practical terms. For example, with Acoustic Emission it isn’t a pre-requisite to perform a frequency analysis (or FFT) and interpret the signal levels at all possible defect frequencies before determining whether or not there is a fault. In fact, with Acoustic Emission the usual measurement sequence is the logical and time saving one of: (a) instantly alert to the presence of a fault on a machine without knowledge of machine details (such as bearing type or number),(b) only look at the trend of readings to reveal the rate of degradation on those machines with a fault flagged,(c) only carry out an FFT if diagnostic information is required of a fault condition.
Of course, such a radical departure from the norm was initially met with a fair degree of scepticism along the lines of ‘It can’t be that easy otherwise why would people use Vibration?’ A fair point in its time! The only answer was to relentlessly demonstrate instant fault detection on the shop floors of those who were interested but doubtful. A not untypical example of readings from such a demonstration is shown below for one-off measurements taken with a portable Acoustic Emission based CM instrument (MHC type) on the various white metal bearings of a generating set in a power station. (Note: for this instrument the common interpretation for all types of machines, bearings and rotational speeds down to 35 rpm is that an item is suspect if Distress® is 10 or more.)
Prior to these measurements being taken, the client believed that the main exciter was as good as new! However upon seeing the readings the client explained that the exciter had previously shown problems of arcing in the bearings and the resulting surface damage had been blended out prior to the bearing being returned to service. The high SNR which Acoustic Emission signals enjoy has other consequence too, as will now be described:
| Measurement Point | Distress® |
| HP Rotor DE | 03 |
| HP Rotor NDE | 04 |
| IP Rotor DE | 05 |
| IP Rotor NDE | 03 |
| LP1 Rotor DE | 04 |
| LP1 Rotor NDE | 03 |
| LP2 Rotor DE | 03 |
| LP2 Rotor NDE | 03 |
| Generator Rotor DE | 04 |
| Generator Rotor NDE | 03 |
| Exciter DE | 19 |
| Exciter NDE | 16 |
| Pilot Exciter | 07 |
Very Slowly Rotating Machinery
At slow rotational speeds the rate at which Acoustic Emission signals are generated reduces, even becoming infrequent at the lowest speeds. However, this does not necessarily pose a problem provided signals are processed accordingly since Acoustic Emission sensors are insensitive to the low frequency sounds and vibrations which are ever present on the shop floor. Commercially available AE instrumentation is able to easily monitor down to 0.25 rpm without requiring special expertise.Non-repetitive or random fault types Because Acoustic Emission signals can be simply analysed directly in the time domain, without recourse to frequency analysis, they are equally sensitive to non-repetitive signals. One example of this has been the detection of carbonisation of oil in a high temperature white metal bearing where the small particles of carbon were crushed in the bearing as they randomly formed. Another example has been the detection of sporadic air bubbles in the oil flowing through a plain bearing.
Reciprocating Machinery
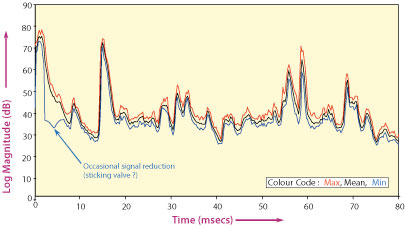
It is normal to get load reversals, valve openings/closures, sliding actions and gas transfers during the operation of reciprocating machinery and each of these has an associated Acoustic Emission signature. A full interpretation of the Acoustic Emission signal requires knowledge of the timing sequence of all these actions but it can also be useful to simply observe occasional or persistent variations from the norm. This is illustrated in the Figure below which shows the maximum, minimum and mean values of the Acoustic Emission envelope signal as a function of time within the cycle of a diesel engine over 12 successive engine cycles. Comparison of the minimum and mean waveforms clearly indicates an occasional drop out of part of the operating process (thought to be due to a sticking valve) which is only detectable because of the high SNR of Acoustic Emission signals – a low SNR would have required averaging to reveal the waveform in the first place thus masking exceptional occurrences.
Intermittent Actions
Similar comments to those for reciprocating machinery apply to intermittent actions. For a single action the high SNR of Acoustic Emission signals is particularly relevant in allowing the signals to be directly analysed without the need for averaging of multiple actions. The high SNR and the resulting suitability of time domain signal processing has had a positive impact on simplifying Acoustic Emission instrumentation. In particular for rotating machinery it has allowed generic time domain signal processing algorithms to be developed which are quick and easy to use. Initially this led to the creation of very simple yet effective portable instruments but, more recently, these algorithms have been incorporated into the AE sensor itself (see example shown below). The importance of this development is that it eases the way for the utilisation of Acoustic Emission sensors with other technology sensors (such as rms vibration and temperature) in shop floor installations as it removes the need for a separate Acoustic Emission instrument. With increased understanding of the fundamentals underpinning the use of AE for CM and the overwhelming evidence of its benefits to industry, it is not surprising that AE has gradually moved centre stage over the years. In addition to having its own standard ISO 22096 (Condition monitoring and diagnostics of machines – Acoustic Emission) it is specifically listed in the CM standard ISO 18436 (Condition monitoring and diagnostics of machines – Requirements for qualification and assessment of personnel) as one of the four main CM techniques, together with Infra-red Thermography, Lubrication Management & Analysis and Vibration Analysis. Alongside these developments the British Institute of Non-Destructive Testing as a UKAS accredited, third party certifying body has recently created a certification programme of training and examinations that conforms to the ISO 18436 international standard.
Related Articles

Shock Pulse Goes Spectrum

Growing Reliability Down on the Wind Farm

The Truth Behind Misalignment Vibration Spectra of Rotating Machinery

How The Eyes (and IR camera) Can Be Misled

Essential Vibration Analysis Tips - All About Sheaves

Visual Inspection: A Necessary Component of Infrared Inspections