Essential Vibration Analysis Tips – All About Sheaves
Alan Friedman, Cat IV, CRL, CMRP, Author; Founder/CEO of Zenco Vibration Experts
Posted 12/12/2024
When it comes to sheaves, proper vibration analysis is critical for identifying faults and preventing costly damage to equipment. These vibration analysis tips highlight two common sheave-related issues—eccentricity and misalignment—and presents practical advice for diagnosing them. From understanding the telltale vibration patterns of an eccentric sheave to recognizing the axial movements caused by misalignment, these insights will help you distinguish between faults, minimize downtime, and protect your equipment from premature wear.
How to Diagnose an Eccentric Sheave
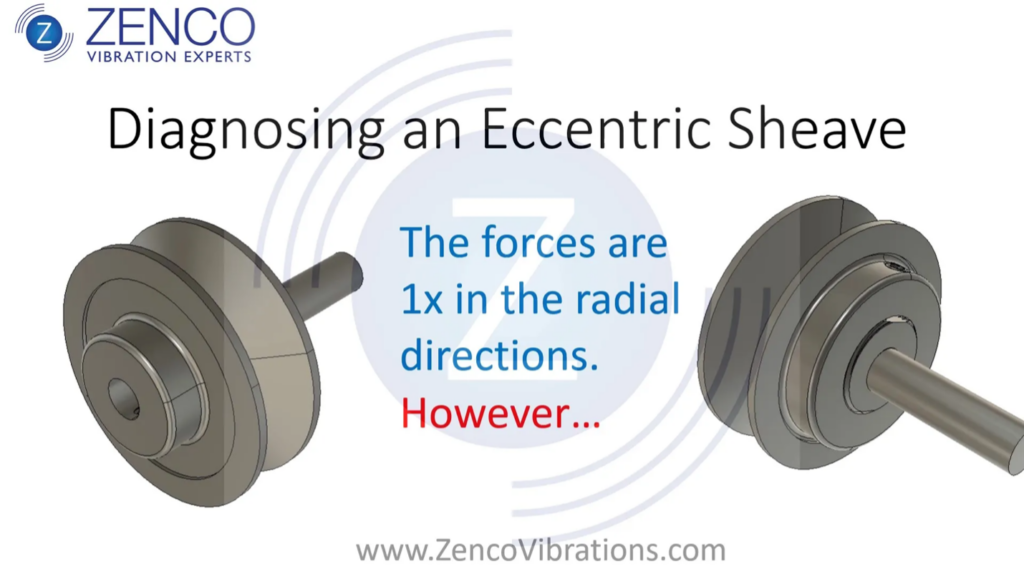
Diagnosing an eccentric sheave with vibration analysis is easy to do. But you have to be careful not to mistake it for other common machine faults. For example, unbalance also shows up at 1x in the radial directions. Fortunately, you can always stop the machine, mount a dial indicator and measure the run out of the sheave directly.
As the eccentric sheave rotates around you can see how it wants to move in the radial directions (vertical and horizontal). It makes one complete cycle of movement with each rotation. The vibration forcing frequency is 1x, or the shaft rate, in the radial directions.
The belt tension changes things however…
…and what we measure in real life are higher levels of vibration in the direction of the belt tension. In each rotation of the eccentric sheave, it pulls the other sheave towards it. We will therefore also be able to measure the vibration on both the input and output bearings in the direction of belt tension.
When you look at the animation without the belt you would also expect the phase relationship between the vertical and the horizontal to be 90 degrees. The belt tension changes this too. This is one of the keys to diagnosing this fault correctly. The phase between the direction of belt tension and 90 degrees away from the belt tension will NOT be 90 degrees as expected but closer to 0 or 180 degrees.
As mentioned earlier, an eccentric sheave can be confused with unbalance. Both result in elevated 1x vibration. Although phase analysis might help you distinguish between the two, it is not always reliable. If the vibration levels are excessive and the problem needs to be resolved, the best approach might be to simply shut the machine down and measure the sheave runout with a dial indicator. You might also use a strobe light to “freeze” the sheave. You might actually see it moving in the direction of the belt tension.
How to Diagnose a Misaligned Sheave
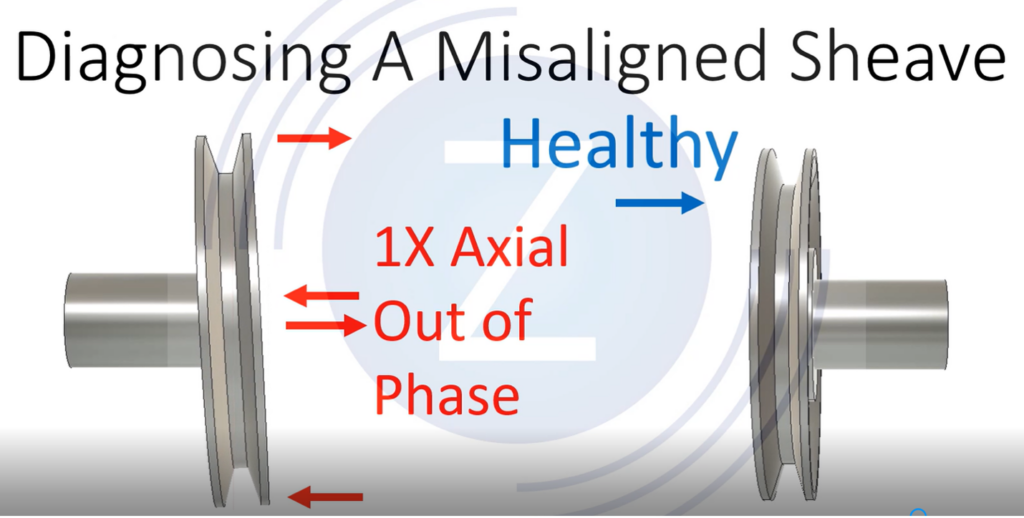
Diagnosing a misaligned sheave is easy to do with vibration analysis. Note how the sheave moves in the axial direction, one cycle of vibration per rotation of the shaft (1x). Note the phase relationships. As the top of the sheave moves to the right, the bottom moves to the left – meaning they are 180 degrees out of phase. The part of the sheave closest to the viewer moves out of phase with the part furthest away. This movement doesn’t happen at all when the sheave is aligned as you can see in the sheave on the right side of the video.
If the machine is not running, one could of course place a dial indicator on the axial face of the sheave and rotate it by hand to observe the movement in the axial direction. The benefit of using vibration analysis is that we can detect the defect while the machine is running.
Below you can see the axial movement and phase relationships for a misaligned sheave from a different angle.
If you have ever played with a strobe light to freeze a shaft, you might consider that the axial movement of the sheave might be visible if you “freeze” it with a strobe light. Simply adjust the strobe light to match the rotational rate of the sheave you want to look at.
Misaligned sheave – Why is it important?
Now that you can see how the sheave moves each time it goes around, think about what this is doing to the bearings! In each rotation of the shaft there are now new axial forces on the bearing. These repetitive forces cause fatigue and fatigue will cause your bearings to wear out faster. A 20% increase in load on a bearing cuts its life in half!
Check out ZENCO’s course schedule and sign up for a course online or in person with Alan Friedman today! https://zencovibrations.com/events/

Alan Friedman
Alan, aka the Vibe Guru, has over 30 years of vibration analysis experience, He has trained 1000’s of students around the world up to Category IV. One of the things that makes Alan a great teacher is his ability to teach people where they are at. Whether you are a math challenged millwright, an engineer or a PhD, Alan will challenge you without overwhelming you. If you are interested in condition monitoring you can also check out his book: Audit It. Improve It! Getting the Most from your Vibration Monitoring Program or hire him for an on-site program audit.
Related Articles

The Interplay of Smart Manufacturing Technologies: IIoT, Industry 4.0, and AI

Keeping Things Moving… Capture Problems Faster With High-Speed Video Technology
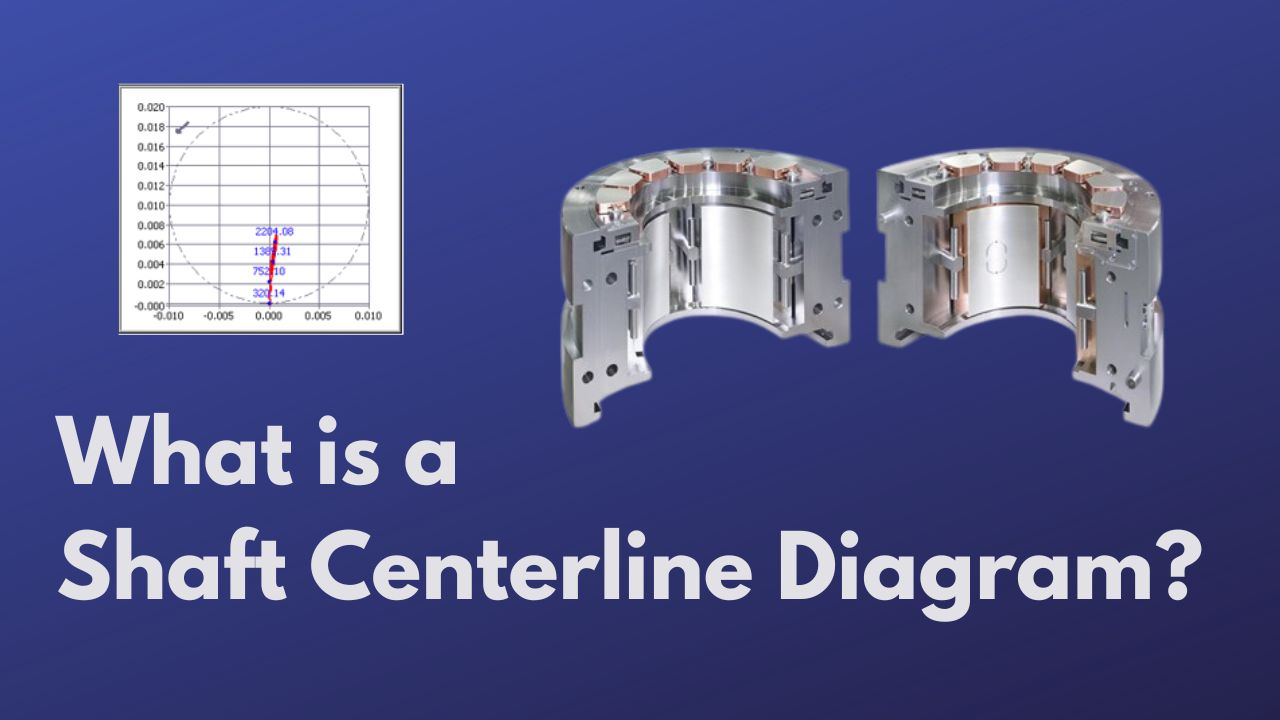
What is a Shaft Centerline Diagram?

Why Condition Based Maintenance Should Be Considered a Critical Component of Any Business’s Asset Maintenance Strategy
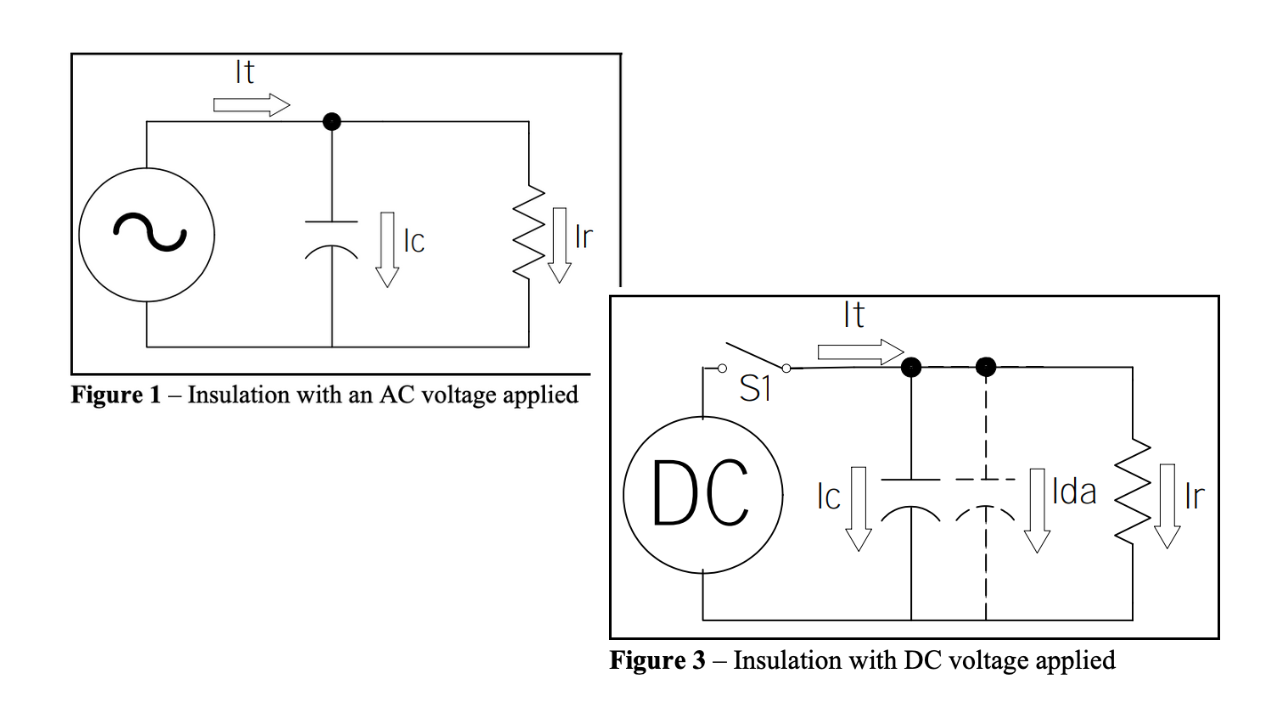
Principles of Insulation Testing

Beyond the Usual Applications for Infrared Thermography