[webinar] Embracing Digital Transformation in Maintenance & Plant Operations | March 13 at 10AM EST – Register Now
How The Eyes (and IR camera) Can Be Misled
How The Eyes (and IR camera) Can Be Misled
Joe Gierlach, Manager – Technical Training & Support, TEGG Corporation
The IR camera is a great tool used in our everyday predictive maintenance endeavors, but it can play tricks on our eyes if we do not investigate beyond what we are observing. Things truly are not always as they seem, here’s an example:
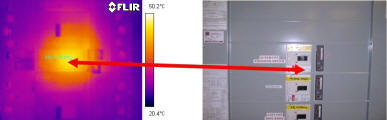
1) As indicated in the images below, we “appear” to have a hot spot and differential in temperature on the “C” phase of the breaker, just to the bottom of the actuator handle.
2) The operating parameters at the time of this visit were as follows:
Rating
200 amps
Loading
“A” – 8 amps
“B” – 48 amps
“C” – 24 amps
THD%C
“A” – <2%
“B” – <2%
“C” – <2%
Millivolt Drop
“A” – .001
“B” – .001
“C” – .001
Relatively normal operating conditions in a generally climate controlled room, with no evidence of any reflective source of infrared radiation noted.
3) So why is there a temperature of nearly 40° C (104° F for those who relate to Fahrenheit)? With a high emissivity on the breaker itself, reflective effects would need to originate from a much higher heat source to have an effect on the observed actual temperature on the breaker.
4) How could the operating parameters be within guidelines, no apparent resistance increase was measured across the breaker contacts via milli-volt observation, harmonic distortion levels were deemed negligible, and the highest load demand on “B” phase DID NOT have the highest temperature rise?
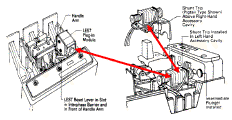
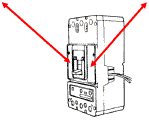
The answer to this was revealed when the breaker manufacturer, Cutler-Hammer, assisted in the dilemma resolution. The source of the heat was determined to be an under voltage relay coil used in conjunction with the electronic sensing and trip unit, mounted under the case at the location illustrated above. The heat associated with electromagnetic induction properties or transformers and coils radiated to the breaker case and were detected by the IR camera.
The unit in question is illustrated in the blow up view, showing this can be either left or right hand mount.
Below is an assembled view illustrating physical location of where “heat” may be observed.
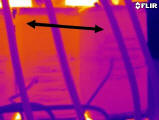
Another good example is illustrated below. A transformer with balanced loading well below its rating, low harmonic content, and no extreme conditions present in the surrounding environment “appears” to have a coil winding that has a temperature difference of nearly 10° C between “B” and “C” phase windings, as indicated by the arrow. The “B” phase winding was approximately 48° C and the “C” phase was approximately 41° C.
Based on those operating parameters, this is a problem as defined by NETA guidelines that is near the “Severe” range as related to our severity criteria levels. In fact, closer quantitative analysis of the thermogram reveals the reasons for the “apparent” differential temperature.
1) The “B” phase winding does not have the volumetric area to allow for natural convection cooling of the heat, thus it cannot dissipate heat as efficiently.
2) The core temperature is much higher as compared to the windings and the heat generated in this area will influence the winding temperatures if its effects are not compensated for. This causes a radiating of heat to impinge on the winding and affect the observed temperature.
3) The actual measured temperature does not exceed the manufacturer specified guidelines with respect to temperature.
Again this example illustrates the absolute need to provide quantitative analysis of any “apparent” thermal anomalies. Other surrounding factors had an effect on what we were observing and they had to be taken into consideration.
Conclusion
With the advent of solid-state protection in devices of this nature, this scenario is going to become more common. We cannot rely on what we see alone, and sometimes even the analytical tools at our disposal still fail to reveal the source of a problem.
The first example aids in demonstrating the absolute need to utilize milli-volt drop tests with respect to thermal anomalies, as it will provide one of several methods in assisting us to prove or disprove the presence of an actual problem, by effectively measuring and quantifying the passive resistance of a contact point using Ohms law, and allowing us to calculate I^2 R losses. With the lack of voltage drop and harmonic currents in this problem, we can safely determine the breaker contacts and terminations are suitable and heating is not related to non-linear loading.
To rely solely on temperature difference from similar components or ambient air is not enough for us to diagnose a problem such as this. Even the generalized guidelines in the NETA specs for electrical equipment cannot be relied upon as a rigid benchmark in this respect. If the NETA standards were applied in the above example, it would be approaching the “Critical” level, as the temperature difference is compared to ambient is nearly 40° C. Is the case in the first example? Would you recommend an immediate outage to service this component? Not likely with the operating conditions noted. In the second example, the untrained eye would most certainly identify this as a problem based solely on differential temperature guidelines.
We must use all of our tools to draw accurate conclusions, as many factors need to be taken into consideration with respect to these types of situations. We cannot just assume that because a certain temperature differential exists, apparent or true, particularly with respect to direct measurement, that a problem exists. Making qualitative and quantitative analysis is key in keeping us one step above the rest. Sure a hot spot exists in these examples, but your eyes can deceive you if you do not give consideration to such variables as external influencing factors and load demands, and not provide proper compensation values to the IR camera for these factors.
For Condition Monitoring (CM) purposes a range of technologies are available, each having its own strengths and weaknesses, and it is usual to consider each of them as a tool in the CM toolkit. The Acoustic Emission (AE) technique has a 40 year history of use for machinery condition monitoring and although it got off to a slow start, in recent years it has gained very widespread acceptance across industry.
For Condition Monitoring (CM) purposes a range of technologies are available, each having its own strengths and weaknesses, and it is usual to consider each of them as a tool in the CM toolkit. The Acoustic Emission (AE) technique has a 40 year history of use for machinery condition monitoring and although it got off to a slow start, in recent years it has gained very widespread acceptance across industry.
In today's industry, practices that were once acceptable are no longer even tolerated. Environmental concerns and EPA mandates are applying more and more pressure on businesses like the chemical industry to improve the manufacturing processes being used, to the point that not only is a slight drip from a pump seal not acceptable, but in 2004 the MACT will be enacted and only 500 - 1,000 parts per million vapor will be allowed and, eventually, no vapor at all.
In today's industry, practices that were once acceptable are no longer even tolerated. Environmental concerns and EPA mandates are applying more and more pressure on businesses like the chemical industry to improve the manufacturing processes being used, to the point that not only is a slight drip from a pump seal not acceptable, but in 2004 the MACT will be enacted and only 500 - 1,000 parts per million vapor will be allowed and, eventually, no vapor at all.
The paper deals with the method of gearbox diagnostics fault detection, and shows that using: design, production technology, operational, change of condition (DPTOCC) factors analysis leads to the inference of gearbox diagnostic information. In the paper is a review of the current possibilities for using mathematical modeling and computer simulation for investigating the dynamic properties of gearbox systems. Computer simulation of dynamic behavior of gearboxes is a powerful tool for supporting gearbox diagnostic inference.
The paper deals with the method of gearbox diagnostics fault detection, and shows that using: design, production technology, operational, change of condition (DPTOCC) factors analysis leads to the inference of gearbox diagnostic information. In the paper is a review of the current possibilities for using mathematical modeling and computer simulation for investigating the dynamic properties of gearbox systems. Computer simulation of dynamic behavior of gearboxes is a powerful tool for supporting gearbox diagnostic inference.
Using the same concept of a trifecta (three factors for success), this article provides companies with the winning strategies of motor maintenance, focusing on the three reliability tasks for electric motor testing and the order in which they should be applied. Following these steps will drastically improve their odds in motor reliability and put a big payday at the end of their production goals.
Using the same concept of a trifecta (three factors for success), this article provides companies with the winning strategies of motor maintenance, focusing on the three reliability tasks for electric motor testing and the order in which they should be applied. Following these steps will drastically improve their odds in motor reliability and put a big payday at the end of their production goals.
When selecting pressure measurement transmitters, the first stage is whether to opt for a transducer or a transmitter. Although the terms are often confused, there are several differences between transducer and transmitter devices. A transducer creates a low-level electronic signal in response to changes in applied or differential pressure. As with transmitters, transducers feature an internal sensor that converts the applied force into an electrical signal, from which the measurement is derived.
When selecting pressure measurement transmitters, the first stage is whether to opt for a transducer or a transmitter. Although the terms are often confused, there are several differences between transducer and transmitter devices. A transducer creates a low-level electronic signal in response to changes in applied or differential pressure. As with transmitters, transducers feature an internal sensor that converts the applied force into an electrical signal, from which the measurement is derived.
If thermography is new in your plant, the first few inspection cycles may yield a large number of finds. Subsequent inspections should go more smoothly. After about three cycles, reorganize the routes so they are more efficient, and add new routes and equipment into the inspection cycle as necessary. The optimum frequency of inspection will be determined by the needs of the equipment assets. As they age, are heavily loaded or are poorly maintained, inspections may become more frequent.
If thermography is new in your plant, the first few inspection cycles may yield a large number of finds. Subsequent inspections should go more smoothly. After about three cycles, reorganize the routes so they are more efficient, and add new routes and equipment into the inspection cycle as necessary. The optimum frequency of inspection will be determined by the needs of the equipment assets. As they age, are heavily loaded or are poorly maintained, inspections may become more frequent.
During Academy of Infrared Training courses, we see many students who have purchased an infrared camera that is not suited for their intended use. These students have put their trust in a camera salesperson, and, many times, that salesperson was solely interested making a sale. Later, these students are disappointed to find out that the camera is not truly suited for their application. This article aims to help the camera buyer understand what basic camera specifications mean, and also help them determine what type of camera and options are suitable for their application. If you note your answers to questions throughout this article, by the end you should have a custom list of applicable specifications and options.
During Academy of Infrared Training courses, we see many students who have purchased an infrared camera that is not suited for their intended use. These students have put their trust in a camera salesperson, and, many times, that salesperson was solely interested making a sale. Later, these students are disappointed to find out that the camera is not truly suited for their application. This article aims to help the camera buyer understand what basic camera specifications mean, and also help them determine what type of camera and options are suitable for their application. If you note your answers to questions throughout this article, by the end you should have a custom list of applicable specifications and options.