MEMS Accelerometer Performance Comes of Age
Ed Spence
In the June/July 2016 Uptime article, “Condition Monitoring and MEMS Accelerometers: What You Need to Know,” several attributes of microelectromechanical system (MEMS) accelerometers were presented that make the technology compelling for condition monitoring applications. This article reviews data demonstrating the state of MEMS technology development and performance levels by comparing it to a commercially available piezoelectric (PZT) condition monitoring accelerometer.
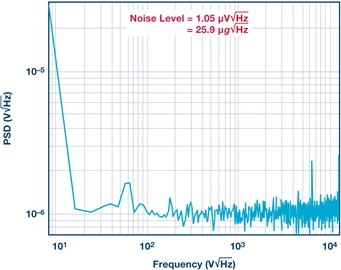
Investment in MEMS process technology, coupled with design innovations, have greatly improved MEMS performance, enough to make MEMS a viable option for a wider range of condition monitoring applications. Accelerometers with resonant frequencies up to 50 kHz and noise density levels down to 25µg/√Hz are now possible with specialized MEMS structures and process technology. Careful design of signal conditioning electronics fully exploits the low Brownian motion noise of these new accelerometers.
Figure 1: The noise spectral density plot for a new, high frequency accelerometer
Performance and Comparison Data
In order to assess whether the newest MEMS accelerometer would be suitable in a condition monitoring application, measurements were taken side by side with a commercially available PZT-type condition monitoring accelerometer. To ensure both sensors had similar mass and were subject to the same stimulus, the MEMS sensor was adhered to the case of the PZT sensor. The single supply analog output of the MEMS accelerometer was inputted directly into the analog input channel of the same data logger as the PZT sensor. A data acquisition instrument (DAQ) was used as the acquisition system for these experiments.
Motor Misalignment Simulation
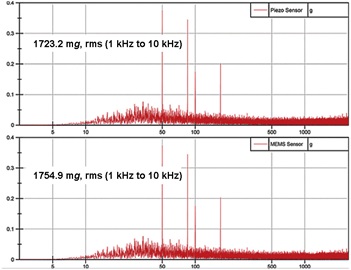
A real-world scenario, such as the one described in Vibration-based Condition Monitoring,1was recreated on a vibration tester in an effort to compare devices using a known stimulus. This example outlined the vibration levels for a gas turbine running at 5100 rpm (85 Hz) and a synchronous generator at 3000 rpm (50 Hz) running misaligned. The scenario describes the frequencies and amplitudes that the vibration system was programmed to produce using the random vibration test mode. Table 1 lists the amplitude measurements at the frequencies of interest for both devices.
| Tone # | Frequency Hz | Level(s) g pk |
| 1 | 50.00 | 0.400 |
| 2 | 85.00 | 0.400 |
| 3 | 100.00 | 0.250 |
| 4 | 170.00 | 0.250 |
Figure 2 shows resulting frequency spectrum measured for the MEMS accelerometer with 21 kHz resonant frequency and the PZT sensor with 25 kHz resonance. The root mean square (RMS) output of the MEMS accelerometer in the band from 1 Hz to 1 kHz is higher than the PZT accelerometer by approximately 30 mg, or 1.7 percent.


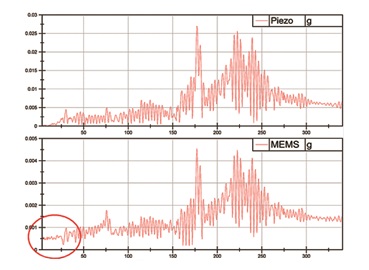
Unlike the PZT device, the MEMS device has a direct current (DC) response, which is of interest for very low frequency machines, such as wind turbines (also enables a faster recovery from saturation). Since the frequency response of the vibration stimulus system rolled off at very low frequencies, the response for both devices were tested by “tapping” the test jig and capturing the resulting responses. The recorded time domain measurement was then transformed to the frequency domain. The results are shown in Figure 3. Note that the MEMS accelerometer was able to record a response down to DC.


Conclusion
The MEMS performance with the analog output driving the DAQ directly achieves good results comparable to the PZT sensor. This suggests that MEMS accelerometers are good candidates for re-architected output channels of new condition monitoring products, in particular enabling entirely new concepts based on semiconductor components that run on a single +5V power supply, such as wireless smart sensors.
On the surface, the first generation accelerometer appeared attractive for this application due to the high frequency resonance (22 kHz) and high full scale ranges (FSR) of ±70 g, ±250 g and ±500g. Unfortunately, the noise level is 4 mg/√Hz, unacceptably high for most condition monitoring applications. For the second generation device used in the comparison, noise is reduced two orders of magnitude from the first generation, while power is reduced to 40 percent. Table 2 summarizes the performance comparison of both MEMS accelerometers, highlighting the improvements in performance.
| 1st Generation Accelerometer | 2nd Generation Accelerometer | |
| FSR | ±70 g to ±500g | ±50 g to ±100 g |
| F0 | 22kHz | 21kHz |
| Supply Current | 2.5mA | 1.0mA |
| Self Test | Yes | Yes |
| Temp Range | -40C to +125C | -40C to +125C |
| Package | 5 x 5 mm 8 pin LCC | 5 x 5 mm 32 pin LFCSP |
| Noise Density | 4mg / √Hz | <30 µg / √Hz |
The convergence of electronic signal conditioning expertise and the development of high resolution MEMS accelerometers have enabled performance capable of serving condition monitoring applications. High frequency MEMS accelerometers with low levels of physical noise, coupled with high performance, low noise, highly stable signal processing design techniques, address the fundamental limitations that have previously kept MEMS from offering performance comparable to contemporary PZT-based condition monitoring sensors.
Reference
- Randall, Robert B. Vibration-based Condition Monitoring. Hoboken: John Wiley & Sons, 2011.
Acknowledgements
Special thanks to Juan Chong of Analog Devices for providing the data for this article.
Click to view the full PDF on Analog Devices.

Ed Spence
Ed Spence is the Marketing Manager responsible for high performance accelerometers for the Industrial Sensors Business Unit at Analog Devices, Inc. Analog Devices designs and manufactures high performance inertial sensors (e.g., accelerometers, gyros), as well as highly integrated solutions, such as inertial measurement units (IMUs).
Related Articles

Use P-F Intervals to Map, Avert Failures

The RCM Trap

Can You Really Justify Reliability Centered Maintenance (RCM)?

Design for Maintainability


