Productivity Improvement Through Operational Reliability and Knowledge Workers
Dibyendu De, Principal Consultant, Reliability Management Consultant, Kolkata, India
Abstract
“…managing productivity of equipment and that of knowledge workers . would be the main challenges of the 21st century.” – Peter F. Drucker
Management Challenges for the 21st Century, Butterworth Heinemann, Oxford, 1999.
This paper presents a case study in a process industry that illustrates how industrial productivity may be increased and business objectives achieved by application of a process termed as REU (Reliability of Equipment Usage). REU basically concentrates on the process of improving operational reliability through knowledge workers. Operational reliability may encompass problems in equipment, process, system, spare parts, cost, purchase, material stocking and a host of other problems connected to business effectiveness. The process is briefly described. The results and benefits of such improvements are highlighted.
Introduction & Background
There is no institution in the world that teaches B-U-S-I-N-E-S-S. We may only get some idea from successful business personalities. So what has Konosuke Matsushita (Founder of Matsushita Corporation) to say about a successful business – that is a business without risk? In his ‘must read’ book – ‘Velvet Glove, Iron Fist’ (PHP Institute, 1991) he states “To run a good business (read without risk) you must develop a good product, sell it at a reasonable price – though high enough to guarantee a fair profit – and collect payments punctually”. Simply said but well said. It means that we must have a proper Quality (Q) of the product that we offer to the customers or clients. It is assumed that the product must be reliable too! It should not break up after we have used it for the second time. How are we to keep a competitive price and yet keep profits? It is only possible if we keep our operating costs (C) to the lowest possible level. In other words we must consciously seek out operational problems that lead to enhanced costs and try keep them to the minimum. That is, there should be a smooth flow of production. Collecting payments punctually means that we must deliver (D) the products in time and that too quick enough. No one would like to pay for goods and services that have not been delivered. So D is not only connected to collecting payments in time but also operating costs. This now leads us to the famous principle of JIT (Just in time) – produce what is required, when it is required and only as much as required. So after many years of doubt and ignorance we have slowly started to realize that Quality (Q), Cost (C) and Delivery (D) are the most significant performance indices of industrial and business performance. By extending our logic a little more we would immediately understand that the most important indices for risk free business operations (Q, C, D) are connected to the operational reliability of the plant. Operational reliability would depend on a host of factors like reliability of equipment, systems, material flow, service etc. In short, there would be different problems that would impede the achievement of operational reliability.
The basic point is that problems never end. We solve one problem only to be confronted by another problem. Situations do not remain stable or reliable. They keep changing with time. This appears to be a very natural process. We attempt to solve problems to keep situations under control – that is to keep matters stable, reliable and productive to meet business objectives. Hence our ability to confront problems, consistently solve problems and the quality of the solutions make us world class. Our quality of reaction to a problem would determine whether we achieve world-class solutions. Quality of our reactions would depend on the quality of the knowledge workers in a particular industry. Quality of knowledge workers is important since all problems are unique in nature and are to be dealt separately. However, observations (through our industrial experimentation) indicate that most problems are genetic and not generic. What does this mean? It means that problems happening in one particular industry (say a cement industry) may not happen in another cement plant. The problems of each plant are unique. Solutions are also unique since the reaction to the problems would differ. Therefore, there cannot be a fixed style or methodology of improving the business productivity and operational reliability of a plant. Only the techniques to solve a particular class of problems may be standardized.
Hence, the REU process is concerned with the problems of any system as such and not necessarily machine problems. It looks into the machine-human interface problems, workflow problems, machine quality problems, spare parts life extension, purchase, materials, sales, secretarial and other operational problems. Therefore the process involves all departments of a plant. Having looked into the problems the process then aims to find the root causes of the problems and tries to fix the problems. The aim is to achieve a smoother system flow by seeking ways to eliminate problems, keep watch on the problems or reduce the frequency of the problems since we will never be free of problems. There is no set decision logic, preconceived strategies or set methodology. The type and quality of the solution would essentially depend on the reaction to a problem and the merit of the problem for a particular industry. So over a period of time the set of solutions become unique to a particular industry in question. To achieve this aim knowledge workers become the center of this process to generate the required set of solutions. Benchmarking is not necessary. Because history shows us that companies who are not benchmarked through their unique set of solutions come to the very top and that too very suddenly. That is what the new economy has shown us. It only shows that older methods to deal with business objectives may no longer be valid and we would basically need new ways to do our work. We shall deal with it in details in this paper.
However, the REU process may be summarized as follows:
- What is the problem?
- What is the reaction to the problem?
- Observe, analyze and solve the problems through appropriate techniques.
- Do it now. That is implementing the solutions immediately. Or if that is not possible then draw up an implementation plan.
Knowledge workers from different disciplines are drawn together to solve the problems. This is known as the High Impact Team Strategy (HITS). HITS then generates Fast Action Solutions (FAS) to improve the system.
This then becomes the foundation to achieve operational reliability.
Outline of the Case
The experimentation was carried out at one of the largest cement plants in India.
This plant is professionally managed and is an ISO 9002 and ISO 14001 certified. It also implemented TQM. The maintenance department has a full-fledged Computerized Maintenance Management System in place. It is also backed up by an advanced Computer aided Condition Monitoring system (all major techniques like Vibration, Wear Debris Analysis, Infra-red Thermal Imaging and Ultrasonic are used).
The plant may be roughly broken up into the following blocks (as per the material flow):
- Raw Mill
- Kiln
- Cement Mill
In addition it has its captive limestone mines.
The Problem
The run factor of the Raw Mill was around 55 to 65%. This was below the expected productivity level. However, the plant chose to produce more from the given resources. That is from 350 T/hr to 550 T/hr. The company expected to achieve the breakeven point if the Raw Mill achieves a run factor of 77%. So the problem may be summarized as achieving operational reliability of the Raw Mill machines.
The Improvement Process
Step 01
A Multi-disciplinary team of knowledge workers was formed. Managers and engineers were taken from Mechanical, Electrical, Instrumentation, Production, and Quality. All of them were connected to the Raw Mill operation.
Step 02
The Raw Mill was broken up into 13 operational blocks like Reclaimer, Transfer RBC, Hopper and Dozimate, Aumund Drag Chain, Mill Proper, Mill Lubrication & Hydraulic System, etc.
Against each of these blocks the Reliability per day (assuming constant rate of failures) was worked out for several months. It was found out that three blocks (Reclaimer, Mill Proper and Mill Lubrication and Hydraulic Systems) were the most unreliable blocks.
The Reliability per day of the entire system was also worked out. This came to 10%.
The Mean Time Between Failures for the System = 10.57 hours. That is we would expect a failure to happen every 11 hours or so.
The Mean Time To Repair for the System = 1.58 hours. That is for each failure we would expect it to be rectified within 2 hours.
A target was set. If the System Reliability were 33% we would obtain a Run factor of over 92 %. This would be more than the desired break-even point.
Step 03
For the three most unreliable blocks all the problems related to the blocks that were faced during the last two years of operations were listed down. Those who have observed the problems described the problem in details.
The group then decided on an appropriate reaction. “Can we eliminate the problem?” or “How can we monitor the problem?” or “What we may do to contain the problem?”.
Based on the reaction the group set about finding the root cause of the problem. To a particular problem there could be one root cause or several causes.
Once the causes were listed down appropriate tasks were formulated to contain the problem or eliminate the problem or monitor the problem.
The technique that was used was termed PLS3D – that is Point, Line, Surface and 3D Awareness. This technique helps in developing a full awareness of the problem. Hence finding a solution becomes easy.
Examples of the Action Tasks
Example 01
Equipment: Reclaimer
Problem: Bucket bends at ends
Actions Tasks:
- Instruct crusher department to keep gap of screen to (- ) 100 mm.
- Refix bucket teeth to original length with probably one additional tooth.
- Stiffen sidewalls by angles.
Example 02
Equipment: Mill Hydraulics
Problem: Thrust pad pressure low?
Action Tasks:
- Clamp pipelines after flow divider to reduce effects of vibrations.
- Inspect Pressure Drop >= 4 bar, clean or replace filter.
- While refilling or recharging oil, centrifuge
- Keep a trend of viscosity measurements every 15 days. If viscosity increases/decreases by 10% electrostatically clean.
- If viscosity > 15% take out 10% of the oil volume and recharge 10% by fresh oil. If viscosity >20% change oil.
In this manner more than 100 problems were solved and the action tasks were implemented. The solutions were reviewed time and again. Not only machinery problems were looked into but also operational and system problems were looked into.
Step 04
The systems were monitored on a regular basis by the group (by this time other groups have also been formed ) by “Group Observation Technique”. This technique basically aims to observe different problems (any problem) through relaxed attention. It is quite different to traditional inspection.
Results
After implementation (with required changes made to the different systems) reliability growth was measured on a month to month basis. A block of eight months was taken and a moving reliability was measured.
Fifteen months from the start of the implementation, the reliability figure touched 31% and a Run factor of 88 to 92 % was achieved.
A Reliability Growth graph is shown below. This was for the Raw Mill. Notice that a moving reliability index for the entire system was taken. A block of eight months was taken. Say that we started to implement the ‘improvement process’ from November. Then the first block would contain the months from March to October (eight months). However, it is not necessary to have eight months. It would depend on the extent of history or records the plant has at its disposal. The next block that is block number 2 would consists of eight months from April to November. Similarly the next block – i.e. block no. 3 would start from May and end in December. And so on.
Steeper the gradient of the graph better are the efforts. Ultimately the graph levels off. This shows the saturation point – i.e. more efforts would not necessarily yield better results.

X axis = month blocks, e.g. 1 = first block of eight months, 2= next block of eight months minus the first month of the first block.
Y axis = Reliability
Series 1 indicates the reliability of the moving blocks.
The growth curve shows a steady and reliable growth achieved due to the efforts put in by the Knowledge Workers.
The next graph shows that how with the improvement of reliability the tonnage production grew.
The next graph shows how power consumption came down with the enhancement of Reliability of Equipment.
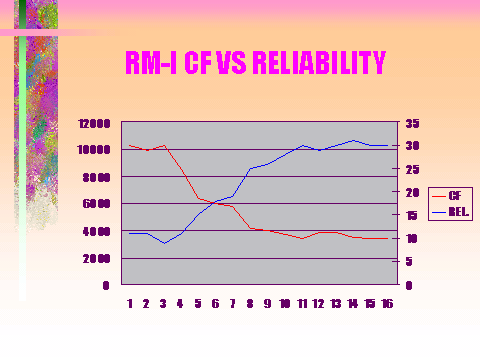
The fourth graph shows that with the increase in Reliability the Maintainability of the equipment were better. This is denoted by the critical factor graph or it is termed as the “Headache Factor.”
CF= Criticality Factor or “Headache Factor.”
REL = Reliability Growth graph as shown earlier.
Benefits
- A steady reliability was achieved with the combined efforts of Knowledge Workers.
- Improvements were achieved at minimal or no costs.
- Business objectives of productivity were achieved and sustained.
- Results were achieved in a very short time.
- No fixed methodology was followed.
- Productivity improved.
- Power consumption came down.
- Maintenance Cost came down by 10 % and is expected to come down further.
- Overtimes were reduced to almost zero.
- The Operational and Maintenance schedules were dynamic and subject to constant review and change.
- Maintenance engineers had now more free time to concentrate on quality solutions.
Conclusions
REU is a flexible process that uses Knowledge Workers to identify problems and eliminate them through appropriate techniques. Effective solutions to problems make any industry world class (it is never a destination to be reached). Thus REU helps industries to be World Class through their unique self-generated solutions and may be applied to manufacturing and service industries alike. Organizations only need to improve the quality of their knowledge workers. How this may be done is the big question?
Dibyendu De, Principal Consultant, Reliability Management Consultant, Kolkata, India


